Introduction
The next time you step outside on a clear, dark night, look up at the sea of stars. Some burn with a crisp, blue-white intensity, while others cast a subtle, warm amber glow. To the naked eye, they look like a random collection of distant lights. However, astronomers possess a single master map that unlocks the secret life stories, temperatures, and ultimate fates of every star you see.
This cornerstone tool is the Hertzsprung-Russell (H-R) diagram. By plotting a star’s energy output against its temperature, this chart transforms a chaotic night sky into a beautifully structured cosmic family tree, bridging the gap between raw science and the wonder of stargazing.
History
The Flawed Map
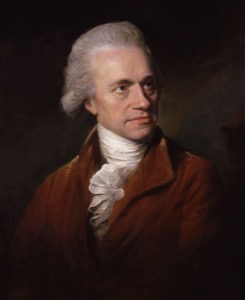
Herschel was already well-established as an important astronomer: four years earlier, he had discovered the planet Uranus from his back yard in Bath.
However, Herschel operated under a fundamentally flawed assumption: he believed that all stars were intrinsically identical in brightness (luminosity). He assumed that if a star appeared faint, it was simply very far away, much like streetlights on a long road.
The Breakthrough: Sorting the Star Catalogs

Between 1911 and 1913, two scientists working independently realized that this wealth of data held a hidden pattern:
- Ejnar Hertzsprung: A Danish astronomer and chemical engineer, Hertzsprung began plotting the absolute brightness of stars against their colors.
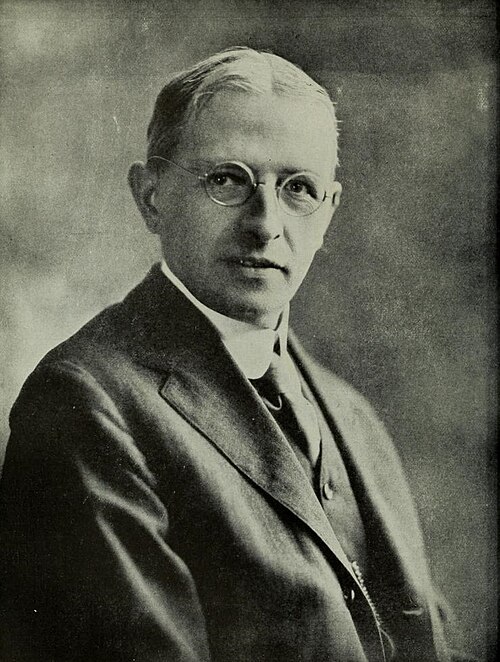
- Henry Norris Russell: An American astrophysicist at Princeton, Russell independently created a similar chart, plotting absolute magnitude directly against the star’s “spectral class” (its chemical fingerprint).
When both men looked at their respective scatter plots, they made a shocking discovery. The stars did not pepper the page like random paint splatters. Instead, they fell into highly disciplined, elegant tracks. This proved once and for all that a star’s brightness and temperature are tightly linked to its size and internal physics, completely overturning Herschel’s century-old assumption.
What it Measures
Fundamentally (or physically), it measures intrinsic luminosity (brightness) on the y-axis, and temperature on the x-axis. But those two quantities are not easy to measure observationally: in both cases we can use other measurements to indirectly determine those two quantities:
Luminosity can be converted to Absolute Magnitude - defined as the magnitude of any star if it were 10 parsecs (32.6 light years) distant. Of course stars are at very different distances, so you have to measure those distances (using different methods) to reach a star’s true luminosity.
Temperature can be estimated through color: comparing the brightness in two different colors (e.g., blue versus “visual” (sort of yellow-orange) or red) gives you a color index that you can correlate to temperature (astronomers construct several color indicies across the entire spectrum, even outside of visible light, like infrared).
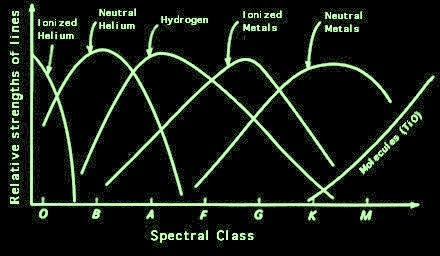
- Stellar Spectra are another way to estimate both: the strength and wavelength of different lines in the spectrum are related to both temperature and luminosity: hotter stars show stronger lines of hydrogen and helium; the cooler stars show lines related to molecules (titanium oxide, etc.). Luminosity changes the character of the lines in predictable ways. So, you can look at the spectrum and tell about how hot the surface is, and get a sense of whether it is a giant star or a dwarf star.
Populations of Stars
The Four Primary Stellar Categories
When you drop thousands of stars onto this grid, they do not scatter randomly. Instead, they sort themselves into distinct groups that reveal their age, size, and current stage of life.
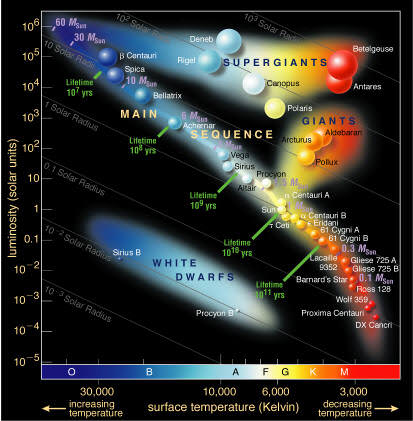
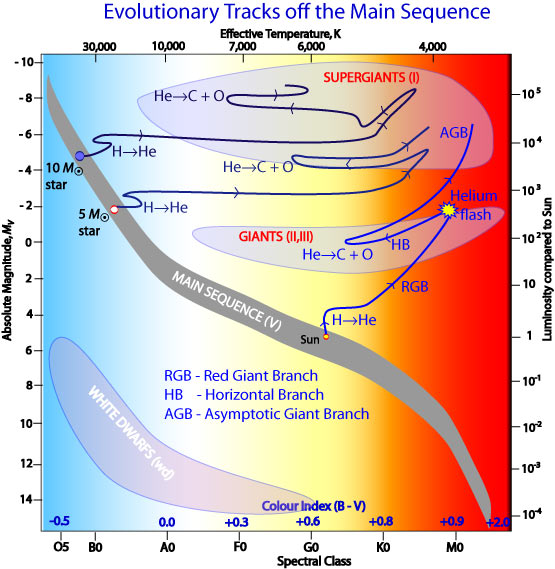
The Main Sequence: This is the crowded, diagonal highway stretching from the top-left to the bottom-right. Stars spend roughly 90% of their lives here, stably fusing hydrogen into helium. Our Sun sits comfortably right in the middle of this line.
Supergiants: Perched at the very top of the diagram, these massive monstrous stars burn through their fuel at an alarming rate. They are highly luminous but can vary wildly in temperature.
Giants: Located just below the supergiants on the upper right, these are aging stars that have run out of hydrogen core fuel. They have expanded and cooled down, glowing a bright, distinct red.
White Dwarfs: Found hiding in the lower-left corner, these are dead stellar remnants. They are extremely hot (hence the position on the left) but incredibly small and faint, slowly cooling over billions of years.
Stellar Evolution in Action
The Sun’s Evolution
The Sun’s evolution - as seen in the animation - follows the typical path of a cool dwarf star:
- Pre-Main Sequence (~50 Myr): the Sun formed from a collapsing gas cloud, enriched with heavier elements from long-gone stars. As it contracts, and the core gets denser, it starts to heat up and moves to the left, towards the Main Sequence.
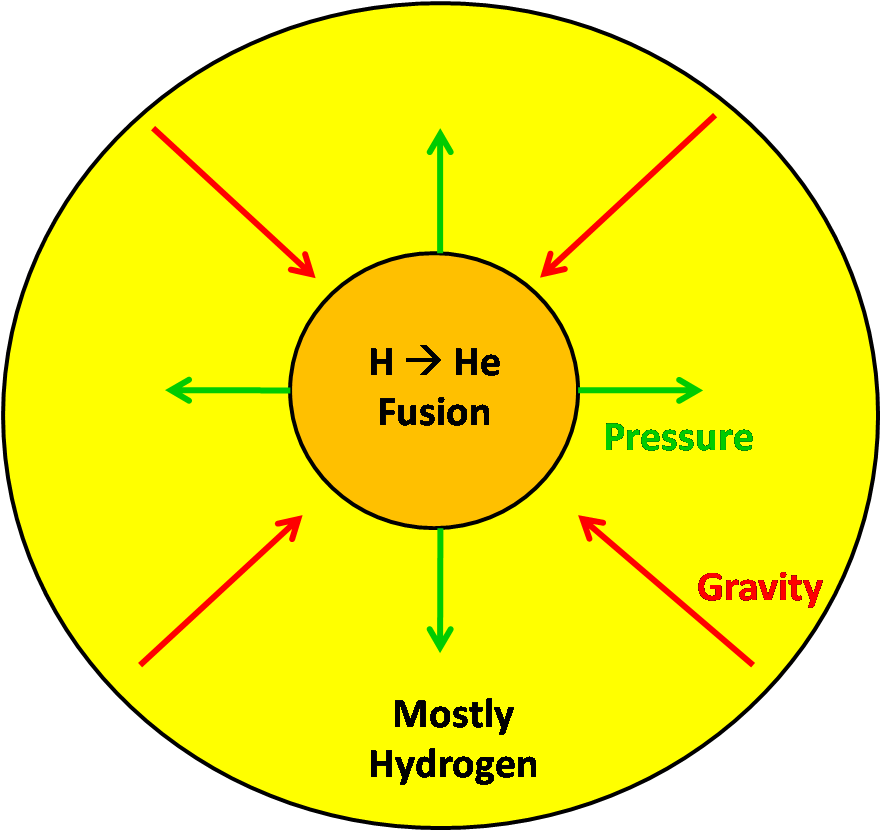
Main Sequence (~10 Gyr; currently 4.6 Gyr through this stage): this is the longest period of its life cycle: here gravity and radiation pressure is balanced (called “hydrostatic equilibrium”) - the Sun is turning hydrogen into helium in its core. Over time it’ll drift slightly upwards and to the right becoming slightly brighter (about 30%) and expanding slightly, as the helium builds up in the core.
Sub-Giant Branch (~100 Myr): as its hydrogen supply starts to become exhausted, it starts to cool, moving rightward, though its luminosity stays somewhat constant. Internally, the core is mostly helium, surrounded by a shell of hydrogen.
Red Giant Branch (RGB; ~1 Gyr): the helium core contracts and heats up, causing and the hydrogen shell to burn furiously. The outer layers swell up - to over 100x its current radius (most of the distance to the Earth - Mercury would be destroyed as this happens). It’s now a red giant star. Even if it doesn’t reach the Earth, the powerful solar wind and associated mass loss will probably push the Earth further out in its orbit.
Horizontal Branch (100 Myr): the core temperature is extremely hot (100 million Kelvin), and an explosive helium “flash” is triggered. As the Sun stabilizes, it starts to burn helium into carbon and oxygen in the core, with a much smaller hydrogen-fusing shell. On the diagram, the luminosity drops slightly, and it moves back to the left.
Asymptotic Giant Branch (AGB; ~20 Myr): core helium starts to run out, and the core is now mainly carbon and oxygen, with a helium shell. It’s here it reaches its maximum size, and becomes unstable, with violent thermal pulses. Earth’s fate will either be vaporized (drag on the Earth will pull it back inward), or possibly it will be pushed out further during the thermal pulsas and avoid being swallowed.
Planetary Nebula (~10 to 100 kyr): blazes to the left (becoming hotter), then plunges downward. Superwinds eject the Sun’s outer layers, exposing the scorching carbon-oxygen core which heats the expelled gas, creating (for a time) a planetary nebula. Compared to other planetary nebulae, the Sun’s will probably be spherical and symmetric, and not extremely bright because the more comlicated examples (like the Dumbbell and Cat’s Eye Mebulas) probably are in binary star systems.
White Dwarf (many billions of years): now in the lower left of the HR Diagram, fusion stors, and the core (which is only Earth-sized) glows only from the leftover energy, cooling very slowly over eons until it becomes a cold Black Dwarf.
The Evolution of Other Stars
All stars follow a similar path to the Sun’s, except the timings and where they end up on the Main Sequence will differ based on their mass:
Massive Stars “live” on the Main Sequence higher up from the Sun: stars like Sirius, Regulus, and the stars in the Pleiades are all hotter than the Sun.
Low Mass Stars “live on the Main Sequence lower than the Sun: these are the dimmer, smaller orange and red dwarfs (and down to even less-massive objects like brown dwarfs).
All will eventually come off of the Main Sequence as they burn through their hydrogren. All will eventually become red giants, and end as a compact object.
But the speed that they run through this evolution is very very different:
- Massive Stars burn hot and burn fast. Where the Sun stays on the Main Sequence for almost 10 billion years, a high-mass star like the brightest stars in the Pleiades only have Main Sequence lifetimes of a few million years; Sirius might only last a couple billion years before becoming a red giant. And the rest of their evolution also proceeds at a rapid pace: supergiant stars like Betelgeuse and Rigel in Orion, didn’t last long on the Main Sequence (just a few million years!) and will burn through their giant phase in about the same time.
Massive stars also have different fates: in their final moments, the core collapse - if the star is massive enough - goes beyond the white dwarf phase with the density high enough to form a neutron star. Even more massive stars implode to the greatest degree and become a black hole.
- Low-Mass Stars burn slowly. Much more slowly. Now the Main Sequence lifetime is in tens or hundreds of billions of years - even trillions of years for red dwarf stars like Proxima Centauri. They’ll evenutally become red giants, but even the earliest low-mass stars in the Universe haven’t been around long enough for that to happen!
Star Clusters
When you have a group of stars in a cluster, you can assume that they’re all about at the same distance. This means their observed magnitude/brightness is enough to plot them all on the HR Diagram, and from that we can learn some important things.
The diagram shows what different star clusters look like on a color-magnitude diagram (CMD). This is just the HR Diagram plotted with the directly observable quantities: magnitude and the B-V color index. But each cluster’s “track” is very different. What they’re showing is that in different clusters, the population of stars might include fewer bright hot stars on the Main Sequence, and sometimes a significant Red Giant population.
Why are they different? Age. All of the stars in the cluster are undergoing evolution and seeing what their distribution is against the Main Sequence tells us the age of the cluster.
The youngest clusters, like the Double Cluster in Perseus (h + χ Persei) and the Pleiades still have hot blue stars, but you can see the hottest stars are starting to curve to the right: those stars are done with the Main Sequence and have started becoming red giants. A few clusters like the Double Cluster and M 41 and M 11 already have both (lower mass) Main Sequence stars and red giant stars. Even not very old clusters like the Hyades and Praesepe each have a handful of recently-become giant stars among their members. Old clusters like M 67 no longer has any hot blue stars - they’ve long become red giants.
Globular clusters are even more extreme - that’s how we know they’re very old.
Seeing the HR Diagram on Your Own
So the next time you’re out under a starry sky, take a few moments to consider the different bright stars you see, the different colors tell a story, and if you know which stars are giants and which are dwarfs, they’re different evolutions.
And, if you’re looking at a nice open cluster, like Messier 41 or others that show a range of color in their stars, consider that you’re watching stellar evolution in action!