Introduction
In the Measuring Distance article, we saw how quickly our everyday rulers – steps, miles, hours of driving – run out once we leave Earth behind. Now, we pick up where they gave out.
Here’s the good news: we already have one piece of the Solar System’s scale. You are standing one astronomical unit from the Sun right now, and so is everyone you know. From that single distance we can map everything else around the Sun. Before we do, though, it’s worth noticing the one fact that makes the Solar System so hard to picture: the things in it are small, and the spaces between them are enormous.
Small Worlds, Big Gaps
The sizes of the planets, moons, and other bodies in the Solar System don’t vary all that much:
Solar System Bodies: Diameters Compared with Earth
| Body | Diameter (km) | Size (🌍 = 1) | Visual Scaling / Notes |
|---|---|---|---|
| Jupiter | 142,984 | 11.209 | Over 11 times wider than Earth |
| Saturn | 120,536 | 9.450 | Nearly 9½ times wider than Earth |
| Uranus | 51,118 | 4.007 | Slightly over 4 times wider than Earth |
| Neptune | 49,528 | 3.883 | Slightly under 4 times wider than Earth |
| Earth | 12,756 | 1.000 | Baseline |
| Venus | 12,104 | 0.949 | Earth’s near-twin in size |
| Mars | 6,792 | 0.532 | Roughly half the width of Earth |
| Mercury | 4,879 | 0.383 | Roughly ⅓ the width of Earth |
| Moon | 3,475 | 0.272 | Just over ¼ Earth |
| Pluto | 2,376 | 0.186 | Less than 1/5th the width of Earth |
| Eris | 2,326 | 0.182 | Marginally smaller than Pluto, but more massive |
| Haumea | ~1,600 | ~0.125 | Highly elongated (~2,320 × 1,704 × 1,138 km) |
| Makemake | 1,430 | 0.112 | Roughly 1/9th the width of Earth |
| Sedna | ~1,000 | ~0.078 | Extreme, distant trans-Neptunian object |
| Ceres | 939 | 0.074 | ~1/14th of Earth; largest object in the asteroid belt |
Apart from the four giants, Earth outranks everything on this list. Nothing here is beyond imagining: Mars is half the width of Earth, Jupiter a bit more than eleven Earths across. Sizes, it turns out, are easy. Distances are another matter entirely – and the quickest way to see that is to use the biggest object in the Solar System as a ruler.
How Many Suns Fit Between Earth and the Sun?
In the previous article, we lined up all the planets between Earth and the Moon and found that they just barely fit. Let’s try the same trick with the Sun itself: how many Suns, lined up edge to edge, would fill the gap between the Sun’s surface and Earth’s?
Suns end to end between the Sun’s surface and Earth’s surface
| Parameter | Value | Space to fill | # Suns |
|---|---|---|---|
| Radius – Sun | 695,700 km | — | — |
| Radius – Earth | 6,371 km | — | — |
| Astronomical Unit | 149,597,870.7 km | 148.9×10⁶ km | 107.0 |
| Earth at perihelion (early January) | ~147.1×10⁶ km | 146.4×10⁶ km | 105.2 |
| Earth at aphelion (early July) | ~152.1×10⁶ km | 151.4×10⁶ km | 108.8 |
Distances like the AU are measured center to center, so to find the open space we subtract both radii – the Sun’s and Earth’s.
At the average distance it comes out almost exactly even: after 107 Suns, only about 16,000 km of space is left over – room for about one more Earth and a bit. Just like the planets between Earth and the Moon, it just fits. But “107” is only true on average. In early January, when Earth is closest to the Sun, only 105 fit; in early July, nearly 109 do. (And another near-coincidence: the Sun is about 109 times wider than Earth.)
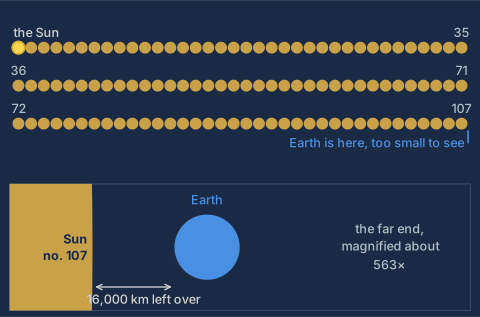
Think about what that means. The Sun is by far the largest thing in the Solar System, and it takes more than a hundred of them to span the distance from us to our own star.
Try it with the outer planets and even the number of Suns stops meaning much: it takes just over 2,000 of them to reach Uranus.
The Asteroid Belt Is Emptier Than the Movies
If there’s one place in the Solar System that movies have taught us is crowded, it’s the asteroid belt: ships weaving between tumbling boulders, rocks close enough to bounce off each other.
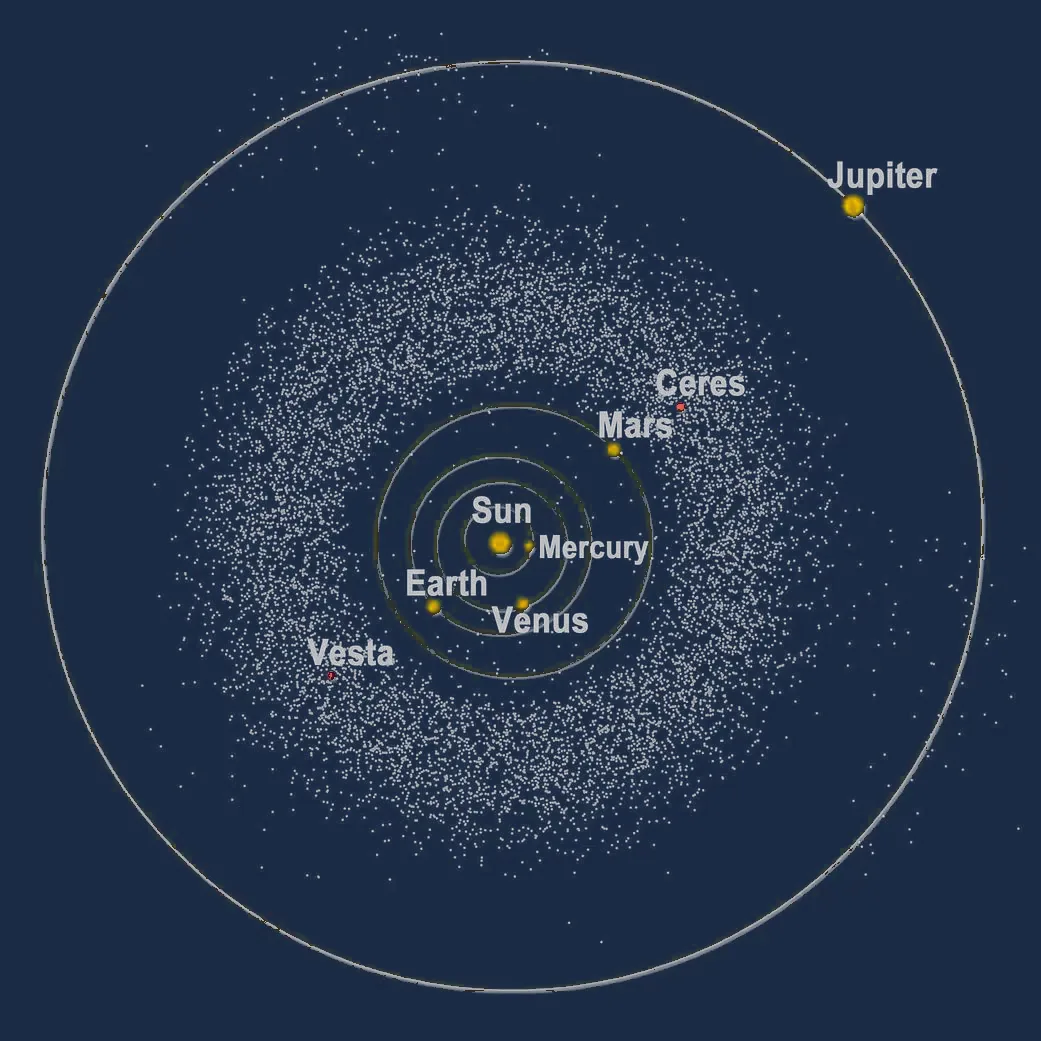
The real belt is nothing like that. It’s estimated to hold somewhere around 1.1–1.9 million objects larger than a kilometer across in the main belt – which sounds like a lot until you see how much room they have. The belt is a vast ring around the Sun, roughly 1 AU across, so those ≥1 km asteroids are typically on the order of 600,000 to 1 million km apart – farther than the Earth-Moon distance. Stand on one, and your nearest neighbor would usually be too far away to see at all, or at best would look like just another faint star.
As an example: seen from a typical spot elsewhere in the belt, Vesta – which has a very reflective surface (albedo about 0.36, roughly three times our Moon’s) – would shine like a dim star of magnitude 5.0–6.5 most of the time; on a rare close pass within ~0.2 AU it might flare up to magnitude 0.5–1.0. Ceres – the largest body in the belt, now classed as a dwarf planet – has a dark surface (albedo about 0.09), even darker than our Moon’s. It would typically be magnitude 6.5–7.0: about as bright as Ceres looks from Earth at its best! And neither would look like a rock in space: at most a few arcseconds across – a point of light, not a world. Spacecraft sent to the outer Solar System cross the belt without steering around anything: NASA estimates the odds of hitting an asteroid while crossing the main belt at about a billion to one. (C-3PO’s famous warning, that the odds of successfully navigating an asteroid field are about 3,720 to 1, gets it upside down. In the real belt, success is practically guaranteed; it’s a collision that’s a billion to one.)
Of all the “neighborhoods” in the Solar System, the one with the reputation for being crowded is, by everyday standards, almost perfectly empty.
The Astronomical Unit
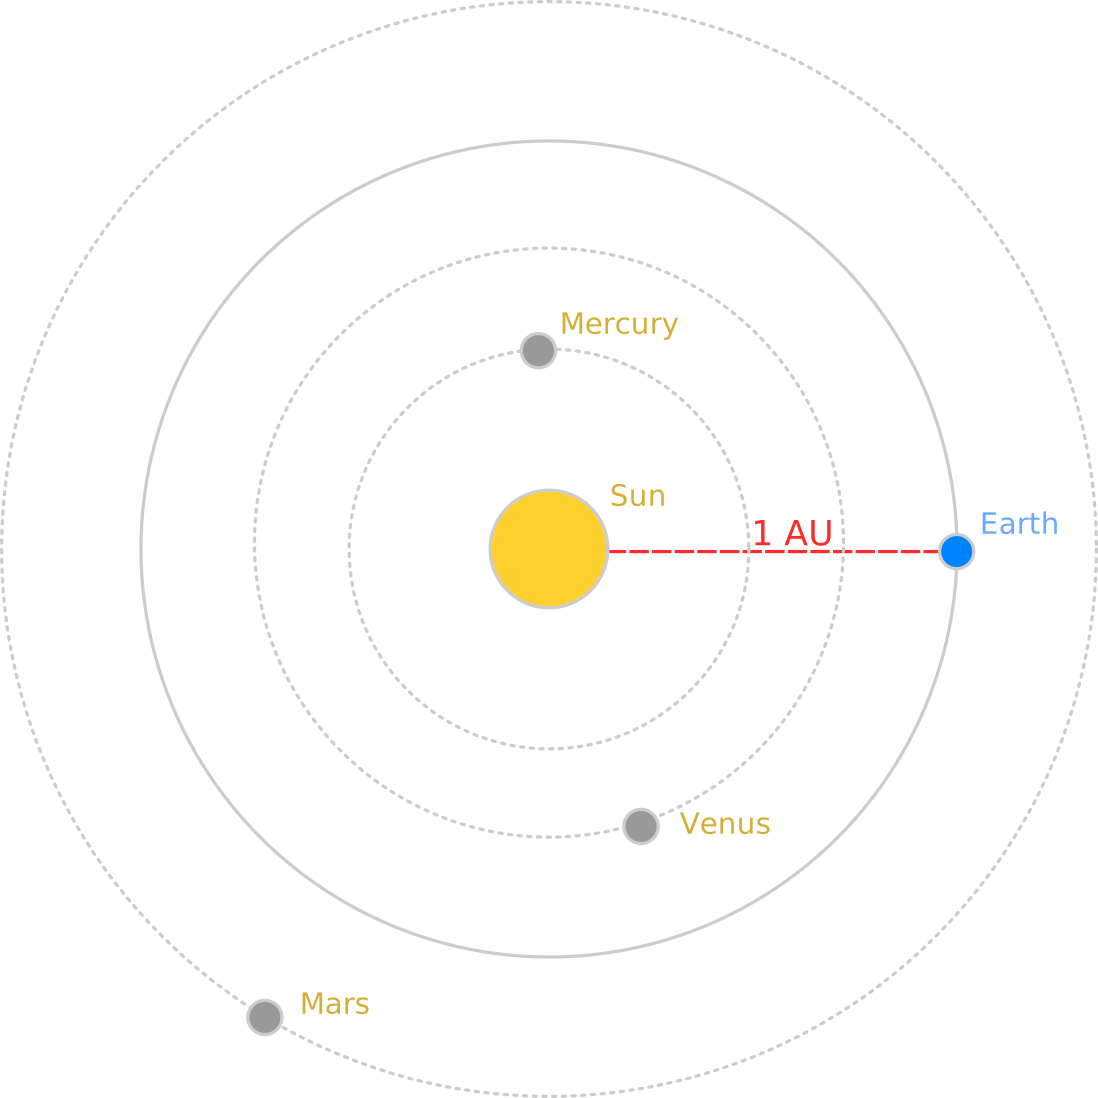
The first ruler is the one you’re sitting on. The astronomical unit (AU) is the average distance between Earth and the Sun: about 150 million kilometers, or 93 million miles. Since 2012 it has been defined as exactly 149,597,870,700 meters.
That raises an obvious question: how do we know? It’s a remarkable story – centuries of it – and it gets its own article later in this series. For now, treat the AU the way you treat a kilometer: you use kilometers every day without knowing how the meter was defined. The AU is a unit first. Its history can wait.
Here’s one way to “feel” it. Earth’s orbit is roughly a circle with a radius of 1 AU, which makes it about 940 million kilometers around. That’s how far you’ve traveled around the Sun since your last birthday – 2π AU – at an average of nearly 30 kilometers every second (about 66,600 mph).
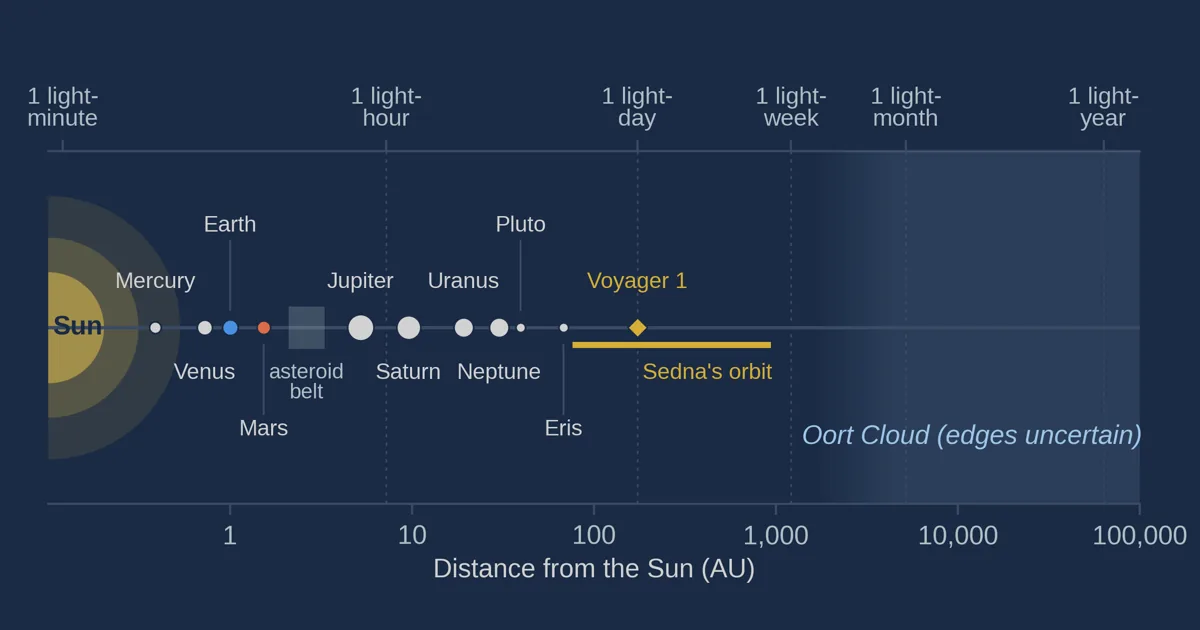
Measured in AU, the whole Solar System suddenly becomes readable:
Solar System Bodies: Distances from the Sun and Orbital Periods
| Body | Mean Distance (AU) | Perihelion (AU) | Aphelion (AU) | Orbital Period |
|---|---|---|---|---|
| Mercury | 0.387 | 0.307 | 0.467 | 88.0 days |
| Venus | 0.723 | 0.718 | 0.728 | 224.7 days |
| Earth | 1.000 | 0.983 | 1.017 | 365.2 days |
| Mars | 1.524 | 1.382 | 1.666 | 687.0 days |
| Ceres | 2.766 | 2.558 | 2.977 | 4.6 years |
| Jupiter | 5.204 | 4.950 | 5.459 | 11.9 years |
| Saturn | 9.582 | 9.021 | 10.124 | 29.4 years |
| Uranus | 19.201 | 18.282 | 20.099 | 84.0 years |
| Neptune | 30.047 | 29.811 | 30.289 | 164.8 years |
| Pluto | 39.482 | 29.658 | 49.305 | 247.9 years |
| Haumea | 43.130 | 34.647 | 51.531 | 284.1 years |
| Makemake | 45.790 | 38.104 | 53.376 | 305.0 years |
| Eris | 67.781 | 38.257 | 97.306 | 557.4 years |
| Sedna | ~544 | ~76.4 | ~1011 | 12,677 years |
The pattern jumps out. The four inner planets are packed within about 1.5 AU of the Sun. Past the asteroid belt, the spacing opens up dramatically: Saturn is nearly twice as far out as Jupiter, and Uranus twice as far as Saturn. Neptune, at 30 AU, is thirty times farther from the Sun than we are. And the list doesn’t stop there – Pluto (whose lopsided orbit brings it closer to the Sun than Neptune for part of each trip around), Eris, and Sedna, whose orbit carries it out to about a thousand AU.
Getting Around by Spacecraft
In the last article, our vehicles were feet, cars, and airplanes. At this scale, the only vehicle we have is the spacecraft – and even it struggles. A trip to Venus typically takes about 4 months. A trip to the outer planets takes years.
The two Voyager spacecraft, launched in 1977, show just how long:
| Event | Voyager 1 | Voyager 2 |
|---|---|---|
| Launch | 5 Sep 1977 | 20 Aug 1977 |
| Jupiter | 5 Mar 1979 | 9 Jul 1979 |
| Saturn | 12 Nov 1980 | 25 Aug 1981 |
| Uranus | — | 24 Jan 1986 |
| Neptune | — | 25 Aug 1989 |
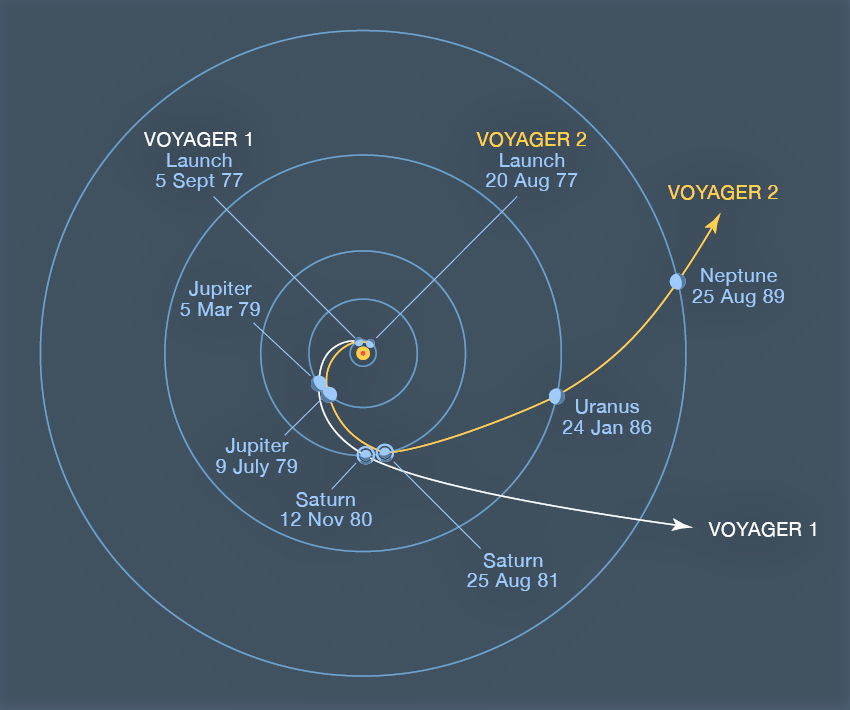
And those trips aren’t even straight lines. On Earth, we know the difference between “as the crow flies” and road miles. In space the gap is bigger, for two reasons: the Sun’s gravity bends every path, and the destination is moving. A spacecraft doesn’t aim at a planet; it aims at where the planet will be when it arrives. The cheapest route from Jupiter to Saturn swings halfway around the Sun: about 22 AU of travel, five times the gap between their orbits.
Voyager 2 needed twelve years to reach Neptune – and that was with a boost from the gravity of every giant planet along the way. At this scale, even our fastest machines start to feel slow. So let’s switch to the fastest vehicle there is.
Light as a Ruler
Light travels about 300,000 kilometers every second. (How we worked that out is a story of its own, and it’s the subject of the next article.) That makes light-travel time a second ruler for the same territory the AU covers.
Usually this gets presented backwards: “the light-time to Neptune is four hours.” But turn the question around and ask how far light gets in a familiar stretch of time – a second, a minute, a day, a month. We have no feel at all for “173 AU” (about where Voyager 1 is right now). But we have a very good feel for what a day is.
How Far Does Light Get?
| In this long… | light travels about… | which gets you to… |
|---|---|---|
| 1 second | 300,000 km | Most of the way to the Moon (1.3 light-seconds) |
| 5 seconds | 1.5 million km | Sun-Earth L2, home of the Webb telescope |
| 1 minute | 18 million km (0.12 AU) | Not even an eighth of the way to the Sun |
| 8.3 minutes | 1 AU | The Sun |
| 1 hour | 7.2 AU | Just past Jupiter’s orbit |
| 4 hours | 29 AU | Neptune |
| 1 day | 173 AU | Voyager 1, on November 18, 2026 |
| 1 week | ~1,200 AU | Beyond even Sedna’s farthest point |
| 1 month | ~5,200 AU | Deep into the inner Oort Cloud (roughly) |
In about a second and a quarter, light reaches the Moon. In eight minutes it reaches the Sun – which means the Sun you see is the Sun as it was eight minutes ago. A full hour barely carries it past Jupiter. Four hours to Neptune. And a day – one ordinary day – takes it out to where our most distant spacecraft is right now.
A few of these stops have stories worth telling.
Five Seconds: Small Enough to Ignore
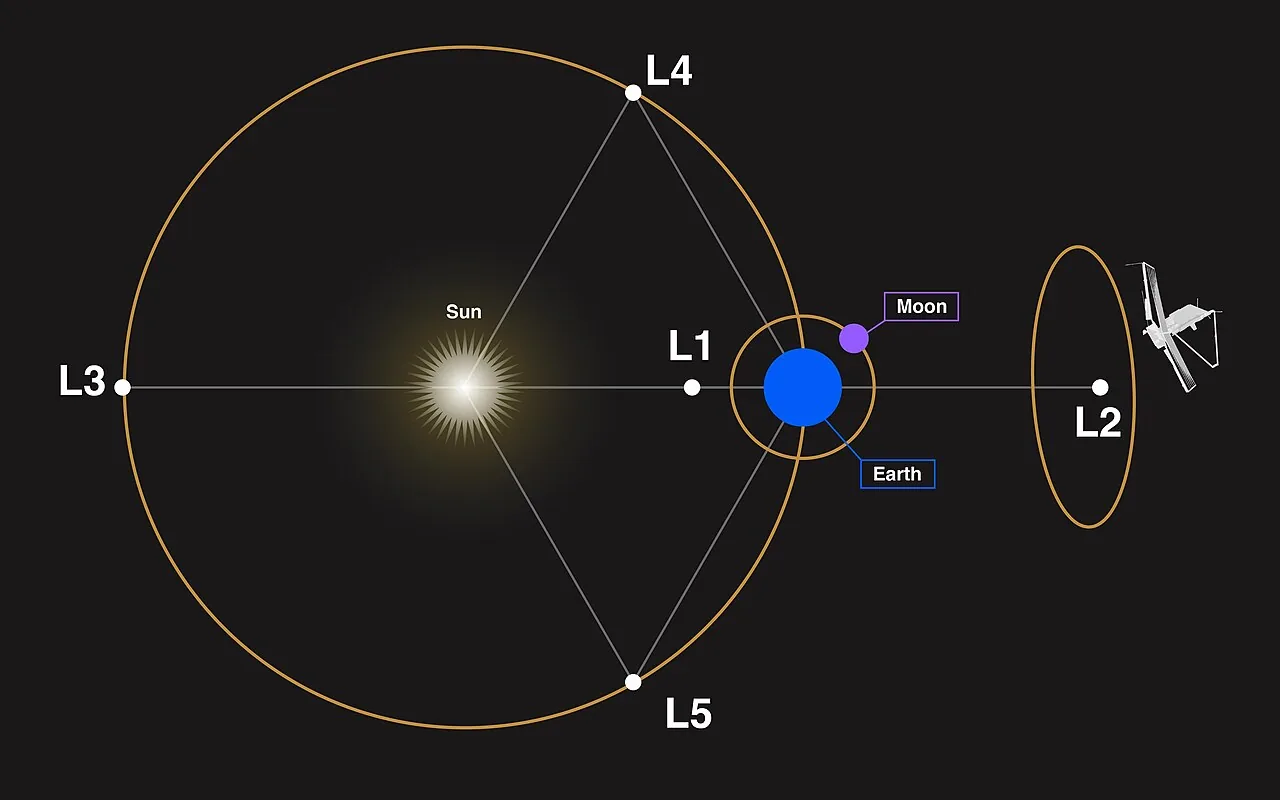
About 1.5 million kilometers from Earth, directly away from the Sun, is a point called Sun-Earth L2 – four times farther than the Moon. The James Webb Space Telescope circles it in a “halo orbit” that ranges from about 250,000 to 832,000 kilometers from the L2 point. The Gaia mission worked there too, until it was retired into an orbit around the Sun, and the Roman Space Telescope will operate there as well.
A signal takes about five seconds to get there, ten for the round trip. For mission controllers, that’s essentially nothing – a short pause on a phone call. Keep that five seconds in mind as a baseline, because the same physics, a bit farther out, starts to matter a great deal.
The 16-Minute Swing
Here’s something the table hides: most of those light-times aren’t fixed. Earth and the other planets are all moving around the Sun, so the distance between us and any other planet keeps changing.
For a planet in a nearly circular orbit, that change works out the same every time. When Earth and the planet are on the same side of the Sun, we’re closer by about 1 AU; when they’re on opposite sides, farther by about 1 AU. That’s a swing of about 2 AU – and 2 AU is about 16.6 light-minutes. Every planet’s light-time swings by roughly the same 16 minutes.
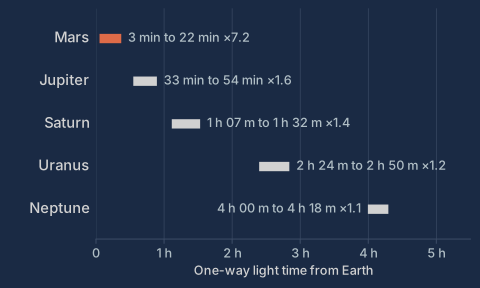
What changes is how much that matters. Neptune’s four hours become four hours give or take eight minutes – a few percent, hardly worth mentioning. But for a planet close to us, the same swing is enormous.
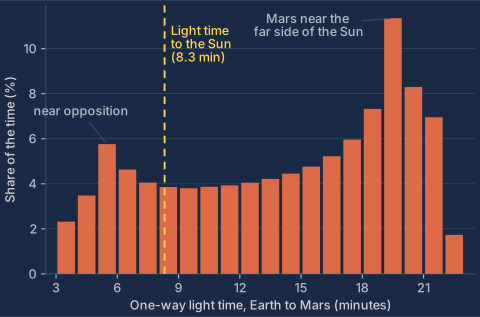
Mars is the extreme case. It’s close enough that the swing dominates, and its elongated orbit adds even more on top. A radio signal to Mars takes as little as about 3 minutes (182 seconds) when the two planets are at their closest, and as much as about 22 minutes when Mars is on the far side of the Sun. That’s a sevenfold change – and it means real-time conversation with a crew on Mars will never be possible. At best, every question waits six minutes for its answer.
And the long delays are the usual ones. Over the years, the median one-way time is about 15 minutes (a distance of about 1.8 AU), the most common delay is 19 to 20 minutes, and Mars is farther from us than the Sun about four-fifths of the time:
The same swing is why some oppositions of Mars get excited headlines while others don’t. At opposition, Earth passes between Mars and the Sun, and Mars is as close and bright as it gets for that cycle. But because Mars’s orbit is noticeably elongated, how close “close” is depends on where in its orbit Mars happens to be:
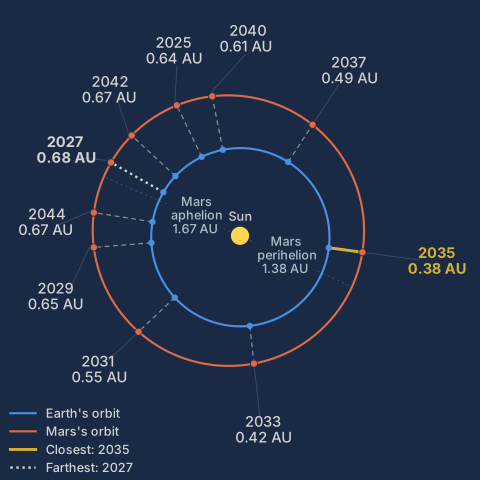
At its best (the next time is in 2035), Mars comes within about 0.38 AU; at its worst, like the coming opposition in February 2027, it stays about 0.68 AU away. Same event, nearly double the apparent size – and roughly 5x the brightness (about 1.75 magnitudes):
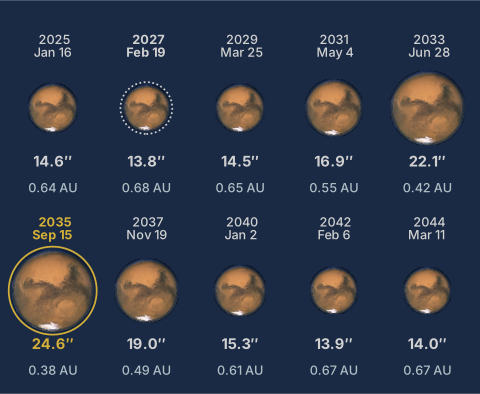
(Why the oppositions come about every 26 months, and why the great ones come only every 15 or 17 years, is a story about lapping on a racetrack – we’ll run that race in its own article in February, just before Mars’s next opposition.)
For almost everything else in the Solar System, the distances change too slowly to notice in a lifetime. Halley’s Comet is the rare exception: its orbit swings it from inside Venus’s orbit to beyond Neptune’s (0.59 AU to 35.14 AU) over 76 years – the one dramatic change in distance a person can actually follow from beginning to end. (Its most recent aphelion was in December 2023, so it’s currently on its way back to the inner Solar System.)
One Light-Day: Voyager 1
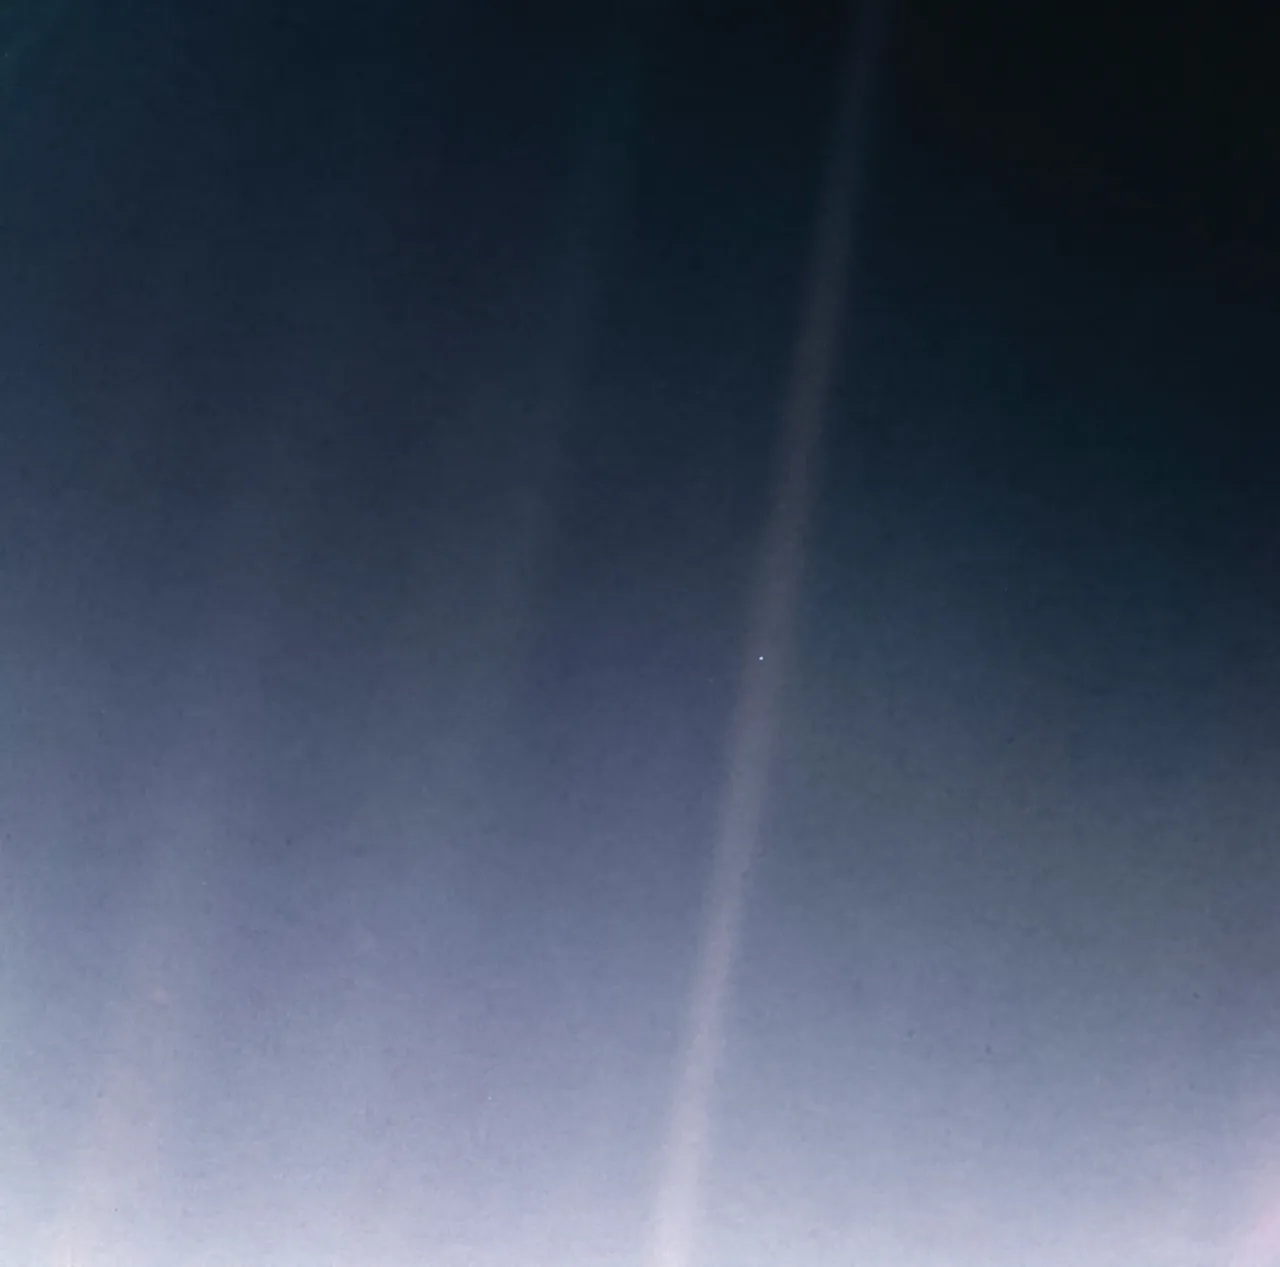
On November 18, 2026, at 10:16 UTC, Voyager 1 will be one light-day from Earth: a signal sent from mission control on one day will arrive at the spacecraft on the next. To reach this milestone, the spacecraft has been traveling for exactly 49 years, 2 months, and 13 days since its launch on September 5, 1977.
Voyager keeps moving outward, about 3.6 AU every year, so this is a milestone that happens once and then slips into the past. Voyager 2 is also still continuing outward, and reaches this milestone around November 2035. Because of its path to visit the outer planets Uranus and Neptune, it’s moving at a slower speed (~15.3 km/s compared to Voyager 1’s ~16.9 km/s). Unfortunately, by the early 2030s, both spacecraft will no longer have enough power to continue operations: from that moment onward, they’ll continue their trek through the outer Solar System silently.
The Outer Wall
Beyond the planets, light-times start to be measured in days. Sedna, one of the most distant known objects in the Solar System, is about 10.5 hours away by light at its closest – and almost six days at its farthest.
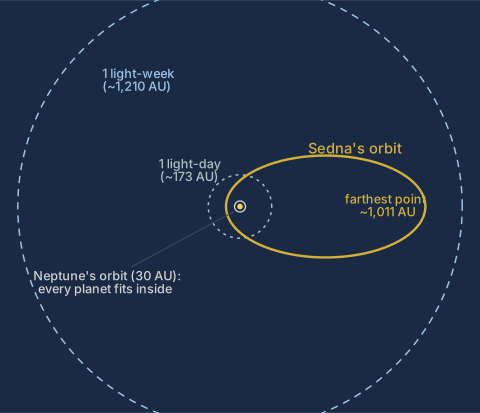
A light-week reaches about 1,200 AU; a light-month about 5,200 AU. Out there, we’re into the Oort Cloud – the vast, sparse shell of icy bodies thought to surround the Solar System – whose boundaries are only roughly known. The table below shows current estimates of its size. The light-month is the outer wall for this article.
Oort Cloud Size and Distance Ranges
| Boundary Zone | NASA Est. Distance (AU) | One-Way Light Travel Time (from Sun) | Equivalent Distance |
|---|---|---|---|
| Inner Edge | 2,000 to 5,000 AU | 11.5 to 29 days | ~300 billion to 750 billion km |
| Outer Edge | 10,000 to 100,000 AU | 58 days to 1.58 years | ~1.5 trillion to 15 trillion km |
Wrapup
The planets are small worlds separated by enormous gaps. We’ve built two rulers for those gaps: the AU, which turns the Solar System into a readable map, and light-time, which turns distances into durations we can actually feel.
Beyond the light-month, the next rung is a light-year – and a light-year gets us to the stars. That step needs a new way of measuring altogether, one we’ll explore later in this series. First, though, we’ve been using the speed of light freely here. In the next article, we’ll find out how anyone ever managed to measure it.