Introduction
The night sky doesn’t hand out its stars evenly. Some blaze, some barely register, and puzzling out why — what “brightness” even means, and how to put a number on it — has occupied astronomers for over two thousand years. That story is the magnitude system: equal parts ancient guesswork, one very good fix in the 1800s, and a modern scale that now stretches from the Sun to the faintest smudge JWST can find.
Where it Started

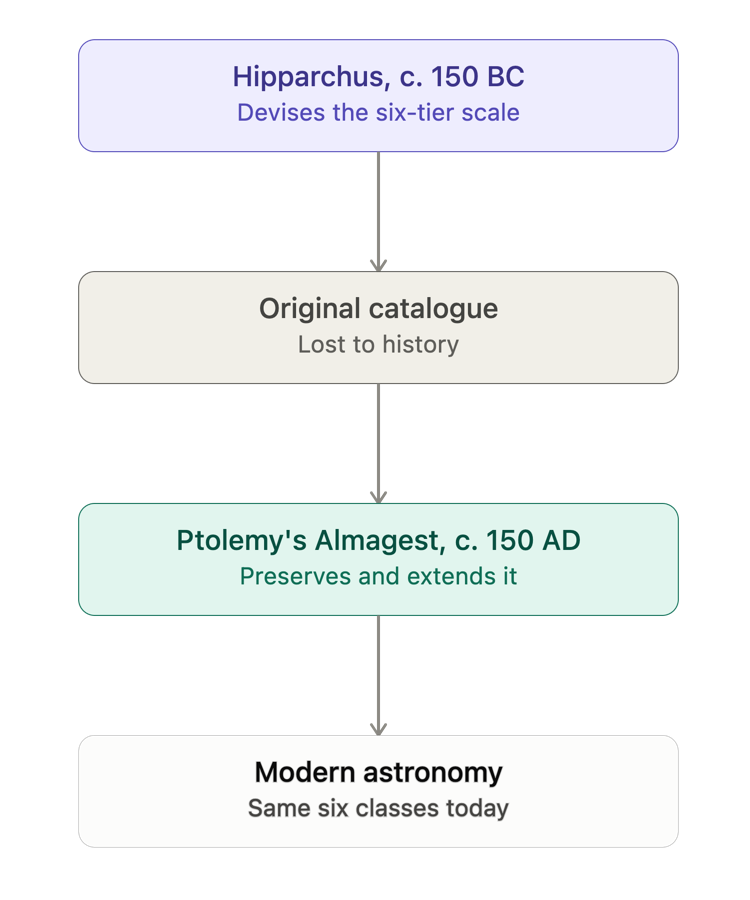

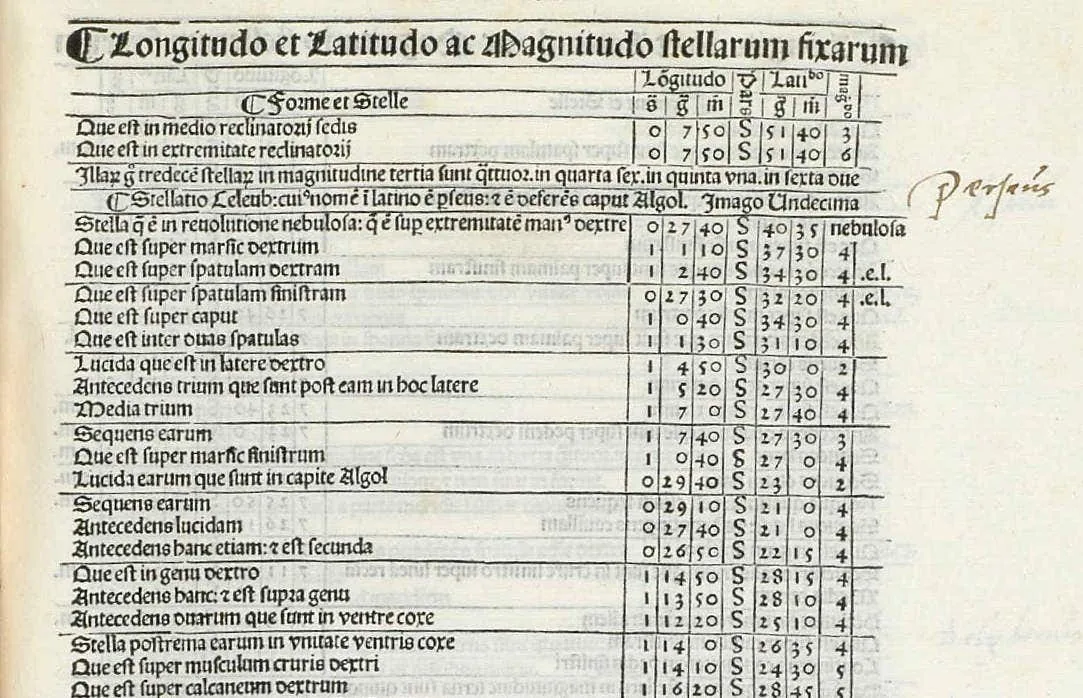
| Magnitude | Stars |
|---|---|
| 1st | 15 |
| 2nd | 45 |
| 3rd | 208 |
| 4th | 474 |
| 5th | 217 |
| 6th | 49 |
Break the catalogue down by magnitude class and the shape of it tells its own story. The bulk of the catalogue sits in the middle, at 3rd and 4th magnitude — genuinely bright stars are rare, and Ptolemy’s naked-eye limit thins the faint end out fast. It’s the same lopsided shape you’d get pointing your own eyes at the sky tonight: a handful of standouts, a broad middle, and a sharp cutoff where your vision simply runs out.
Pogson’s fix (1856)

Pogson noticed that astronomers’ existing eye estimates already put a 1st magnitude star at very close to 100 times brighter than a 6th magnitude star. So he built the new scale around that number: a difference of exactly 5 magnitudes was defined to mean exactly a 100x difference in brightness. Since there are 5 steps between magnitude 1 and magnitude 6, each single step had to be the fifth root of 100 — a factor of about 2.512.
| Mag. Diff. | Brightness Difference | Roughly |
|---|---|---|
| 1 | 2.512 | 2½ |
| 2 | 6.310 | 6½ |
| 3 | 15.851 | 16 |
| 4 | 39.818 | 40 |
| 5 | 100.023 | 100 |
| 6 | 251.257 | 250 |
| 7 | 631.157 | 650 |
| 8 | 1585.467 | 1600 |
| 9 | 3982.692 | 4000 |
| 10 | 10004.522 | 10000 |
Expressed as a formula, for two objects with measured brightness (flux) F₁ and F₂:
m₁ − m₂ = −2.5 log₁₀(F₁ / F₂)
The elegant part of Pogson’s fix is that it didn’t throw away 2,000 years of history to get there. Because he anchored the formula to the same six familiar classes astronomers already used, a star Ptolemy called “3rd magnitude” and a star measured at magnitude 3.0 today are, for practical purposes, the same brightness. Pogson didn’t invent a new scale — he gave the old one a precise mathematical backbone.
How Magnitudes are Used
Once magnitude had a real mathematical definition, it stopped being a way to rank naked-eye stars and became a general currency for “how bright is anything.” Pogson’s formula doesn’t care what kind of object it’s describing — a planet, a galaxy, or the Sun itself all get slotted onto the same scale, and because the scale is logarithmic it stretches comfortably in both directions: deep into negative numbers for the dazzling stuff, and as far into positive numbers as our instruments can chase.
| Object | Apparent Magnitude | Notes |
|---|---|---|
| Sun | −26.7 | |
| Full Moon | ≈ −12.7 | |
| Venus, at its brightest | ≈ −4.6 | varies from −4.4 to −4.9 with distance and phase |
| Jupiter, at opposition | ≈ −2.9 | |
| Sirius (brightest star) | −1.46 | |
| Faintest stars, naked eye | ≈ +6.5 | up to +7.0 in the darkest skies |
A couple of those numbers are ranges rather than fixed values, and that’s not measurement sloppiness — it’s real. Venus’s brightness changes as its distance from Earth and illuminated phase shift over its orbit, the same way the Moon is only at its brightest when it’s both full and near perigee. The magnitude system doesn’t just rank objects; it can track an object changing brightness over time, which is exactly what it’s built to do.
That Sun-to-naked-eye-limit range comes to about 33 magnitudes — by the 2.512×-per-step math, the Sun is on the order of ten trillion times brighter than the faintest star you can pick out with your own eyes. Every observing session you’ll ever have happens somewhere inside that enormous range — and, as later sections get into, modern telescopes push the faint end of it very much further still.
Apparent vs. Absolute magnitude
Everything up to this point has been apparent magnitude (m) — how bright something looks from here, on Earth, right now. It’s the number a telescope or your own eye actually measures. But apparent magnitude conflates two completely different things: how much light an object actually puts out, and how far away it happens to be. A nearby dim star and a distant brilliant one can land on the exact same apparent magnitude and look, from where you’re standing, indistinguishable.
That’s the problem absolute magnitude (M) solves. Absolute magnitude asks a hypothetical question: how bright would this object look if we could pick it up and place it at a fixed, standardized distance — 10 parsecs (about 32.6 light-years) — from us? Put every star at the same distance and apparent brightness stops being about geometry; it becomes a direct comparison of intrinsic luminosity.
Why 10 parsecs specifically? Mostly convention, and a slightly embarrassing bit of history: the figure was chosen in part because Vega — the traditional reference star anchoring the whole magnitude system — was long believed to sit at roughly that distance. Modern parallax measurements have since refined Vega’s actual distance to about 7.68 parsecs, but the 10-parsec definition was already locked in by the time the correction came along, so it stayed. It’s a clean round number now more than it is a meaningful one.
Apparent and absolute magnitude are tied together by the distance modulus:
m − M = 5 log₁₀(d) − 5
where d is the distance in parsecs. Given any two of the three quantities — apparent magnitude, absolute magnitude, distance — the formula gives you the third. Historically, that’s exactly backwards from how it’s used in practice: measure a star’s apparent magnitude, work out its absolute magnitude some other way (from its spectrum, say), and the formula hands you its distance.
A few real stars make the apparent/absolute split concrete:
| Star | Apparent Magnitude | Absolute Magnitude | Distance | Brightness Difference |
|---|---|---|---|---|
| Sirius | −1.46 | +1.43 | 8.6 ly (2.64 pc) | 14.3x fainter |
| Vega | +0.03 | +0.58 | 25.0 ly (7.68 pc) | 1.7x fainter |
| Rigel | +0.13 | −7.84 | 848 ly (260 pc) | 1542x brighter |
| Antares | +0.96 | -5.28 | 550 ly (170 pc) | 313x brighter |
| Pollux | +1.14 | +1.08 | 33.8 ly (10.4 pc) | 1.06x brighter |
| Proxima Centauri | +11.13 | +15.60 | 4.25 ly (1.30 pc) | 61.4x fainter |
Sirius and Vega are both nearby and both intrinsically bright, so their apparent and absolute magnitudes stay in the same rough neighborhood. Rigel and Antares are the interesting cases: they look fainter in our sky than either one, yet their absolute magnitudes (−7.84 and −5.28) make them two of the most luminous stars visible to the naked eye — tens of thousands of times more luminous than the Sun. The only reason they don’t dominate the night sky is distance: both sit hundreds of parsecs away, versus single-digit parsecs for Sirius and Vega. Apparent magnitude alone would never tell you that; absolute magnitude does.
Pollux, in Gemini, is a nice coincidence: it sits only slightly beyond 10 parsecs, so its apparent and absolute magnitudes differ by just 6% — too small a gap to notice by eye. Proxima Centauri, the nearest star to us, shows the opposite extreme: move it an additional 8.7 pc away and it fades a further 4½ magnitudes.
What’s the most luminous naked-eye star visible from here? Well, ζ1 Scorpii comes in second to η Carinae (which isn’t visible from our latitude). It’s a 4th magnitude star, but seeing it is going to be a challenge: it’s one of the “tail” stars in Scorpius at a declination of -42.35° so it scrapes the southern horizon (maximum altitude = 5°) - but if you can catch it, is has impressive statistics: it’s a blue hypergiant star (B1.5 Ia+) about 1.-1.6 million times brighter than the Sun but since it emits most of its light in the ultraviolet, it’s visual absolute magnitude would be about -8.5, slightly more than Rigel.
Photometric bands (UBVRI / Johnson-Cousins)
Every magnitude number used so far in this article — Sirius at −1.46, Rigel at −7.84, all of it — is assuming one specific thing: that “brightness” means brightness as seen through a particular slice of the light spectrum. It doesn’t have to. Astronomers regularly measure stars in ultraviolet, infrared, and everything between, and a star’s brightness can look completely different depending on which slice you’re measuring.
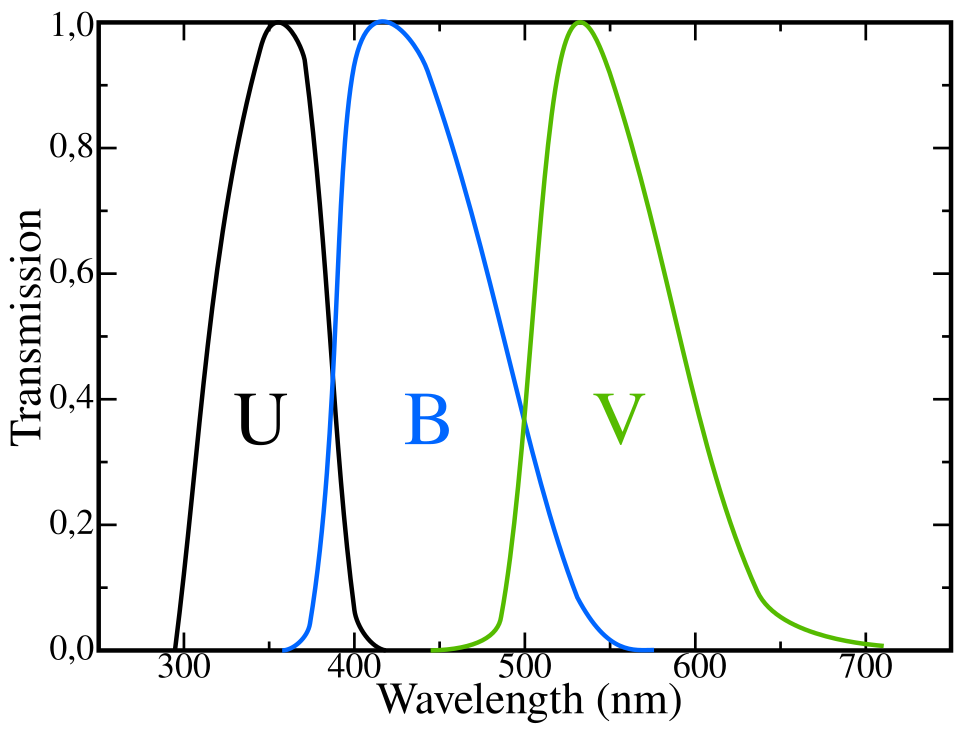
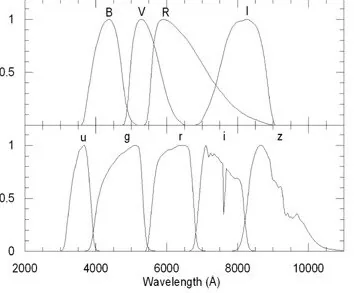
This isn’t the only system in use, and knowing that explains something that can otherwise be confusing: look up the same star in different places and the quoted magnitude sometimes doesn’t quite match. Modern surveys often use their own band systems — Gaia’s G band is a single very wide band spanning most of the visible and near-infrared spectrum at once, and the Sloan Digital Sky Survey uses five bands (u, g, r, i, z) with a different wavelength coverage and a different zero-point convention entirely. None of these systems are wrong; they’re just measuring slightly different things, the same way a temperature reading in Celsius and Fahrenheit both describe real heat without being interchangeable numbers. If a figure you find elsewhere for a familiar star looks slightly off from what’s quoted here, a photometric-system mismatch is often why.
Color Index
| Spectral Type | B-V Index | Temp. (K) | Color |
|---|---|---|---|
| O5V | -0.33 | 41,400 | Blue |
| B0V | -0.30 | 31,400 | Blue-white |
| B5V | -0.16 | 15,300 | Blue-white |
| A0V | 0.00 | 9,700 | White |
| A5V | +0.16 | 8,100 | White |
| F0V | +0.30 | 7,300 | Yellow-white |
| F5V | +0.44 | 6,500 | Yellow-white |
| G0V | +0.59 | 5,950 | Yellow |
| G2V (Sun) | +0.65 | 5,780 | Yellow |
| G5V | +0.68 | 5,660 | Yellow |
| K0V | +0.82 | 5,270 | Orange-yellow |
| K5V | +1.15 | 4,400 | Orange |
| M0V | +1.42 | 3,850 | Red |
| M5V | +1.83 | 3,060 | Red |
If Photometric bands introduced the idea of measuring a star in different colors of light, color index is what you get from comparing two of them directly. The most common version is B−V — literally the B magnitude minus the V magnitude for the same star — and it turns out to be one of the simplest, cheapest ways to learn a star’s temperature.
Here’s why it works: a hot star pours out relatively more of its light at short (blue) wavelengths, so its B magnitude comes out brighter (more negative) than its V magnitude — B−V ends up negative or close to zero. A cool star does the opposite, weighted toward the red end of the spectrum, so its B magnitude is comparatively fainter than its V — B−V comes out larger and more positive. No spectroscope required, no complicated physics on the observer’s end — just two brightness measurements and a subtraction, and you get a genuine physical property of the star. A few reference points make this concrete. Vega defines the color index scale’s zero point by convention, and Sirius, another hot white star, sits close to it at B−V ≈ 0.00. The Sun, by comparison, is yellow-white and comes in at B−V ≈ +0.65. The two extremes are the same pair from earlier in this article: Rigel, blistering hot at around 12,000 K, has a color index of −0.03 — distinctly blue. Betelgeuse, a cool red supergiant at roughly 3,600 K, comes in at B−V ≈ +1.85 — about as red as naked-eye stars get. Next time you look at Orion, the color difference between its two brightest stars isn’t just an aesthetic detail; it’s a number you could, in principle, measure yourself.
The HR Diagram against a large sample of stars illustrates how these things tie together:
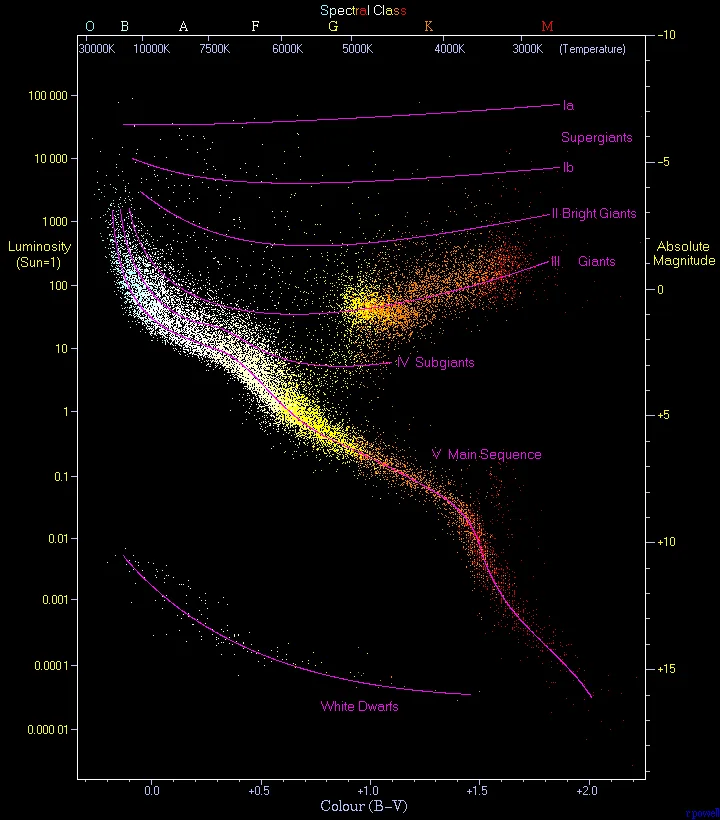
On the x-axis, as temperate decreases, the color of stars shift from blue to white to yellow to red, and the spectral types move from O to M. (The specific association between spectral type and temperature differs slightly with luminosity class.) Similarly the Y axis shows the relationship between luminosity relative to the Sun and absolute magnitude.
Distance modulus & standard candles

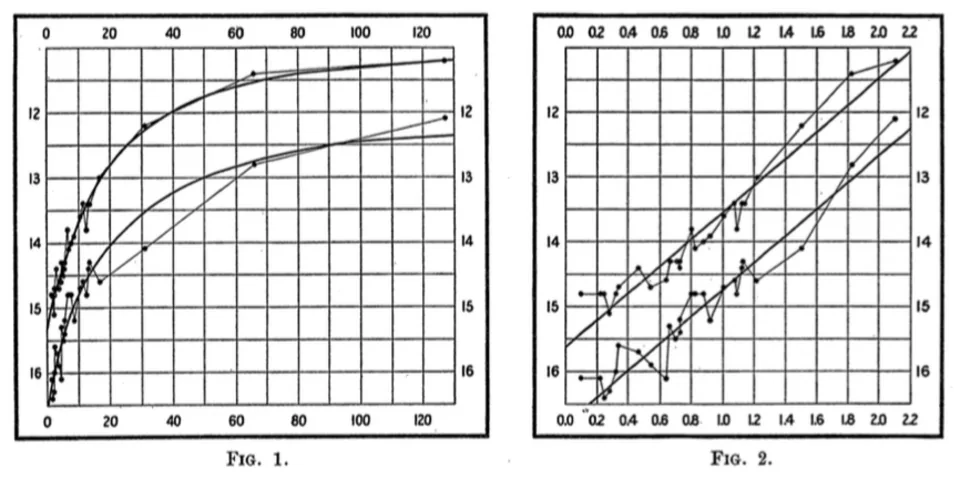
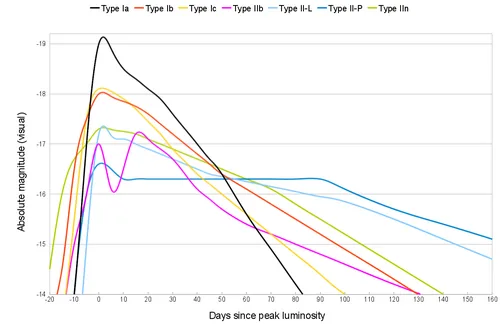
Type Ia isn’t the only supernova standard candle, just the best one. Type II-P supernovae — the ones whose light curves flatten into a plateau for weeks after peak, rather than declining steadily — can also be pressed into service, though by a different trick: their raw peak brightness varies wildly, but the brighter ones expand faster, and correcting for that measured expansion velocity narrows their scatter to nearly Type Ia levels. It takes more work per object (the correction requires a spectrum, not just a brightness measurement), which is why Type Ia remains the workhorse. The other supernova classes — the ones whose progenitors vary too much, or whose brightness depends on unpredictable leftover material from the star that exploded — haven’t yielded an equally reliable trick, and aren’t used as distance candles at all.
Atmospheric extinction (incl. the Little Dipper practical test)
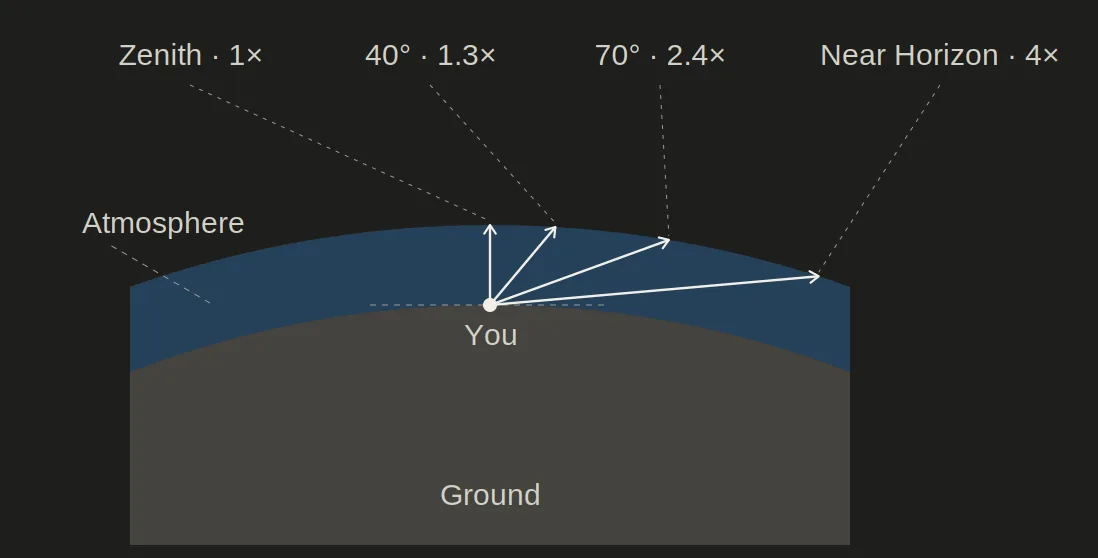
Every star you look at is shining through Earth’s atmosphere, and how much atmosphere depends entirely on where in the sky it sits. Look straight up, and starlight travels through the thinnest possible slice of air. Look toward the horizon, and that same light has to cut through a slant path many times thicker — more air to scatter and absorb photons before they reach your eye. This is why the full Moon looks distinctly duller and more orange near the horizon than overhead, and it’s the same reason a star can visibly dim as it sets.
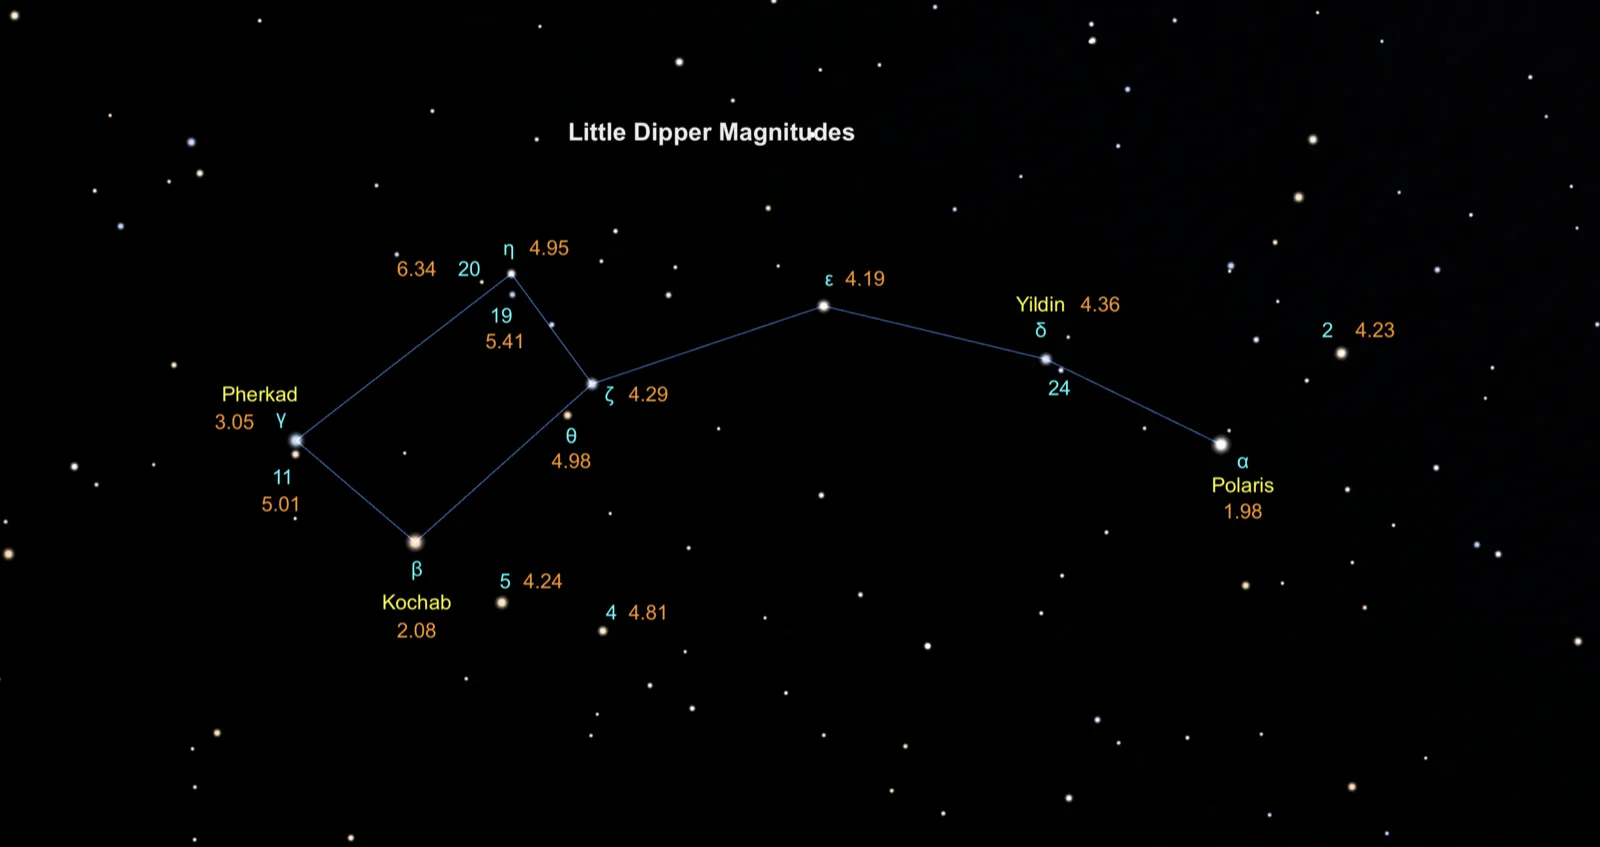
| Star | Magnitude | Role as benchmark |
|---|---|---|
| Polaris (α) | 1.98 | Visible from nearly anywhere, even light-polluted suburbs |
| Kochab (β) | 2.08 | “Guardian of the pole” — easy from most locations |
| Pherkad (γ) | 3.05 | The other “guardian” — starts to separate decent from mediocre skies |
| ε UMi | 4.19 | |
| ζ UMi | 4.29 | |
| Yildun (δ) | 4.36 | Suburban-fringe test |
| η UMi | 4.95 | Faintest — seeing this means a genuinely dark site |
Can you pick out Yildun and the epsilon/zeta pair? You’re past magnitude 4.2 — a genuinely good suburban-fringe sky. Catch all seven, including faint eta? That’s dark-sky territory, magnitude 5 or better — and you did it with nothing but your own eyes, aimed at a part of the sky doing you the favor of sitting still, high overhead, all night long.
Limiting magnitude: eye vs. binoculars vs. telescopes vs. imaging
Every method of looking at the sky has a floor — a faintest magnitude beyond which nothing more can be squeezed out, no matter how hard you look. That floor keeps dropping as technology improves, and tracing exactly how far it’s dropped is one of the more startling ways to grasp what “more light-gathering power” actually buys you.
For a telescope, the widely used approximation is:
limiting magnitude ≈ 7.7 + 5 log₁₀(D)
with D as the aperture in centimeters. It’s a rough rule — different sources in the literature put the constant anywhere from about 6.8 to 8.7 depending on assumptions about sky darkness, magnification, and the observer’s own eyes — but it captures the core relationship: doubling your aperture buys you about 1.5 magnitudes deeper, regardless of what aperture you started from.
That formula also tells you exactly where it fails, which is instructive in its own right. Plugging William Herschel’s 48-inch mirror into it predicts a limiting magnitude around 18 — but a detailed 2014 reconstruction of his actual observing conditions, accounting for the specific mirror coating he used, put his real limit closer to magnitude 15.7. The gap is the mirror itself: Herschel’s speculum-metal mirrors reflected only about two-thirds of the light hitting them, versus well over 90% for a modern aluminized or silvered surface. The formula assumes reasonably good optics; the 18th century didn’t have them yet.
Cameras and electronic sensors break the rules entirely, because they can do something the eye can’t: integrate light over time. A longer exposure keeps collecting photons long after your eye would have given up, which is why astrophotographs routinely show detail far fainter than any eye could see through the same telescope. But this doesn’t mean you can simply expose forever and see anything. Once you’re collecting enough light that random noise (rather than the faintness of the object) is the limiting factor, the signal-to-noise ratio improves only with the square root of exposure time — doubling your exposure buys you just over a quarter of a magnitude deeper, and going a full magnitude deeper costs roughly six times the exposure. Worse, the sky itself isn’t black: airglow and light pollution add their own steadily accumulating signal, so past a certain exposure length you’re not gathering more of your target, you’re just gathering more sky. That combination — diminishing returns plus a rising background — is why even world-class imaging setups have a real, practical floor.
Smart telescopes complicate this picture in an interesting way. A device like the Unistellar eQuinox 2 has a modest 114mm aperture — smaller than plenty of amateur Dobsonians — yet its manufacturer quotes a limiting magnitude around 16 under light-polluted skies and 18.2 under dark rural ones. Real users have caught Eris, magnitude 18.7, in under an hour with one. That’s not a contradiction of the aperture formula; it’s the imaging advantage from the previous section showing up directly. A 114mm scope viewed by eye would top out somewhere around magnitude 13. Stack enough exposures electronically, and the same aperture reaches five magnitudes fainter — deeper, from a device you can carry in one hand, than Herschel’s room-sized 48-inch mirror managed with the naked eye.
Smaller smart scopes tell a more modest but consistent story. Independent field tests of the 50mm Seestar S50 — astronomers stacking exposures and cross-checking results against catalog photometry — consistently land on a reliably-measurable limiting magnitude around 15 under ordinary suburban skies with a typical half-hour of stacking. Scaling down further to the 30mm Seestar S30 by aperture alone suggests a dark-sky ceiling somewhat fainter than magnitude 15, though that’s an estimate from the physics rather than a documented field result.
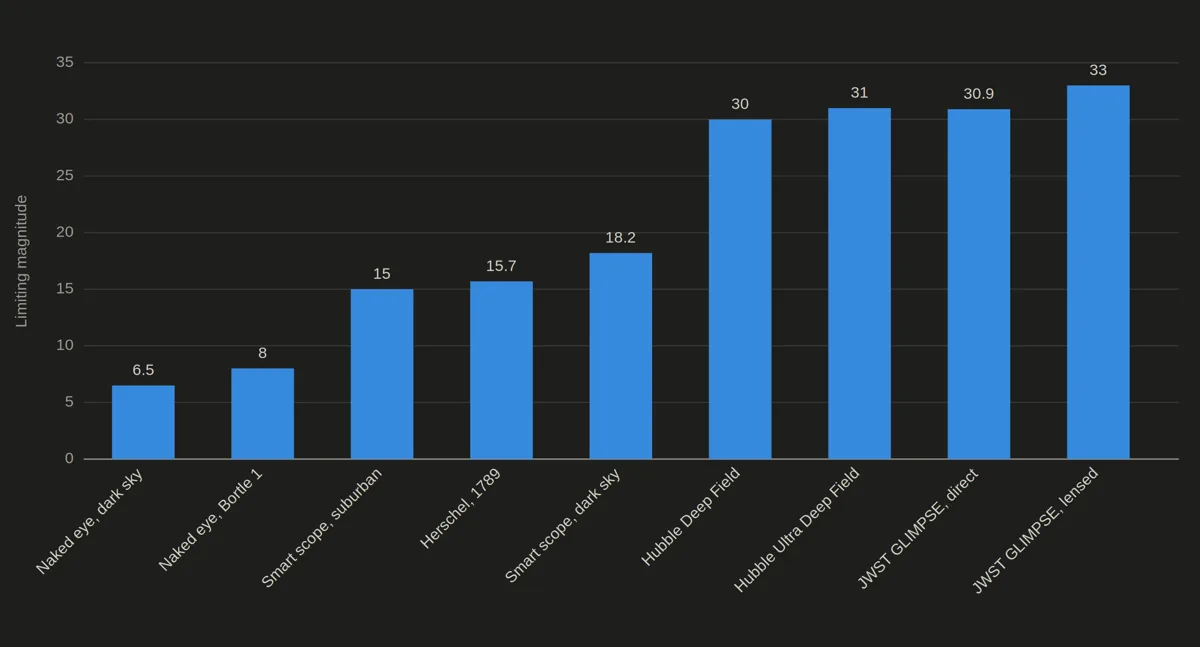
| Era / instrument | Limiting magnitude |
|---|---|
| Naked eye, typical dark sky | ~6.0–6.5 |
| Naked eye, exceptional dark-sky site (Bortle Class 1) | 7.6–8.0 |
| Galileo’s telescope (~1610) | Not dramatically fainter than naked eye — his breakthrough was resolution and detail, not depth |
| Herschel’s 40-foot reflector (1789, 48-inch mirror) | ~15.7 |
| Smart scopes + dark sky + long exposure | 16.5-18.5, depending on aperture |
| Hubble Deep Field (1995) | ~28.6–30 |
| Hubble Ultra Deep Field (2004) | ~31 |
| JWST GLIMPSE program (2025), with gravitational lensing | ~30.9 directly; beyond 33 for lensed regions |
From the naked eye’s roughly magnitude 6.5 to JWST’s lensed depth beyond magnitude 33 is about 26.5 magnitudes — and because each magnitude step is still that same 2.512× from Pogson’s fix back at the start of this article, that gap works out to roughly 40 billion times fainter. Every telescope, every camera, and every clever trick like gravitational lensing in this table exists to push that one number a little further down.
Digital vs. eye photometry
A CCD or CMOS sensor is fundamentally linear: twice the photons hitting a pixel produces twice the electrical signal, reliably, across most of its working range. Feed it real starlight and the numbers it reports scale directly with actual brightness — no distortion, no compression.
The eye doesn’t work that way, and never has. Its brightness response is classically described by the Weber-Fechner law — logarithmic, where each perceived “step” in brightness is a multiplicative jump in actual light, not an additive one. That’s why Pogson built a logarithmic scale in the first place: he was matching a scale to how brightness already behaved to the eyes doing the observing. (Modern vision science generally prefers Stevens’ power law, roughly a cube-root relationship, over a pure logarithm — but either way, the eye compresses a huge range of physical brightness, which is why the magnitude scale felt natural enough to stick.)
That mismatch is exactly what a smart telescope’s software resolves every time it produces an image: the sensor reports linear photon counts, and turning that into a recognizable astrophoto — let alone a number like “magnitude 15.7” — means converting those counts back through the same logarithmic scale. The eye at the screen is still doing what eyes have always done; the sensor and the software in between are doing something else entirely.
Surface brightness magnitude (mag/arcmin²)
Every magnitude discussed so far has been a total — all the light from an object, added up, treated as if it came from a single point. That works fine for stars, which really are point-like even in a large telescope. It breaks down completely for anything with real size on the sky: galaxies, nebulae, comets. Two objects can have wildly different total magnitudes and still look about equally easy — or hard — to see, because what actually matters to your eye is how concentrated that light is, not how much of it there is in total.
Surface brightness fixes this by measuring brightness per unit area on the sky. Among amateur observers, the conventional unit is magnitudes per square arcminute (mag/arcmin²) — the unit Stellarium, most observing handbooks, and most planetarium software actually report. (Some professional literature instead uses magnitudes per square arcsecond, a unit that looks very different numerically for the same object — arcminute-based and arcsecond-based values differ by about 8.9 magnitudes for the same patch of sky, so always check which one you’re reading before comparing numbers across sources.)
A handful of well-known galaxies make the point concretely:
Sample of High Surface Brightness Galaxies
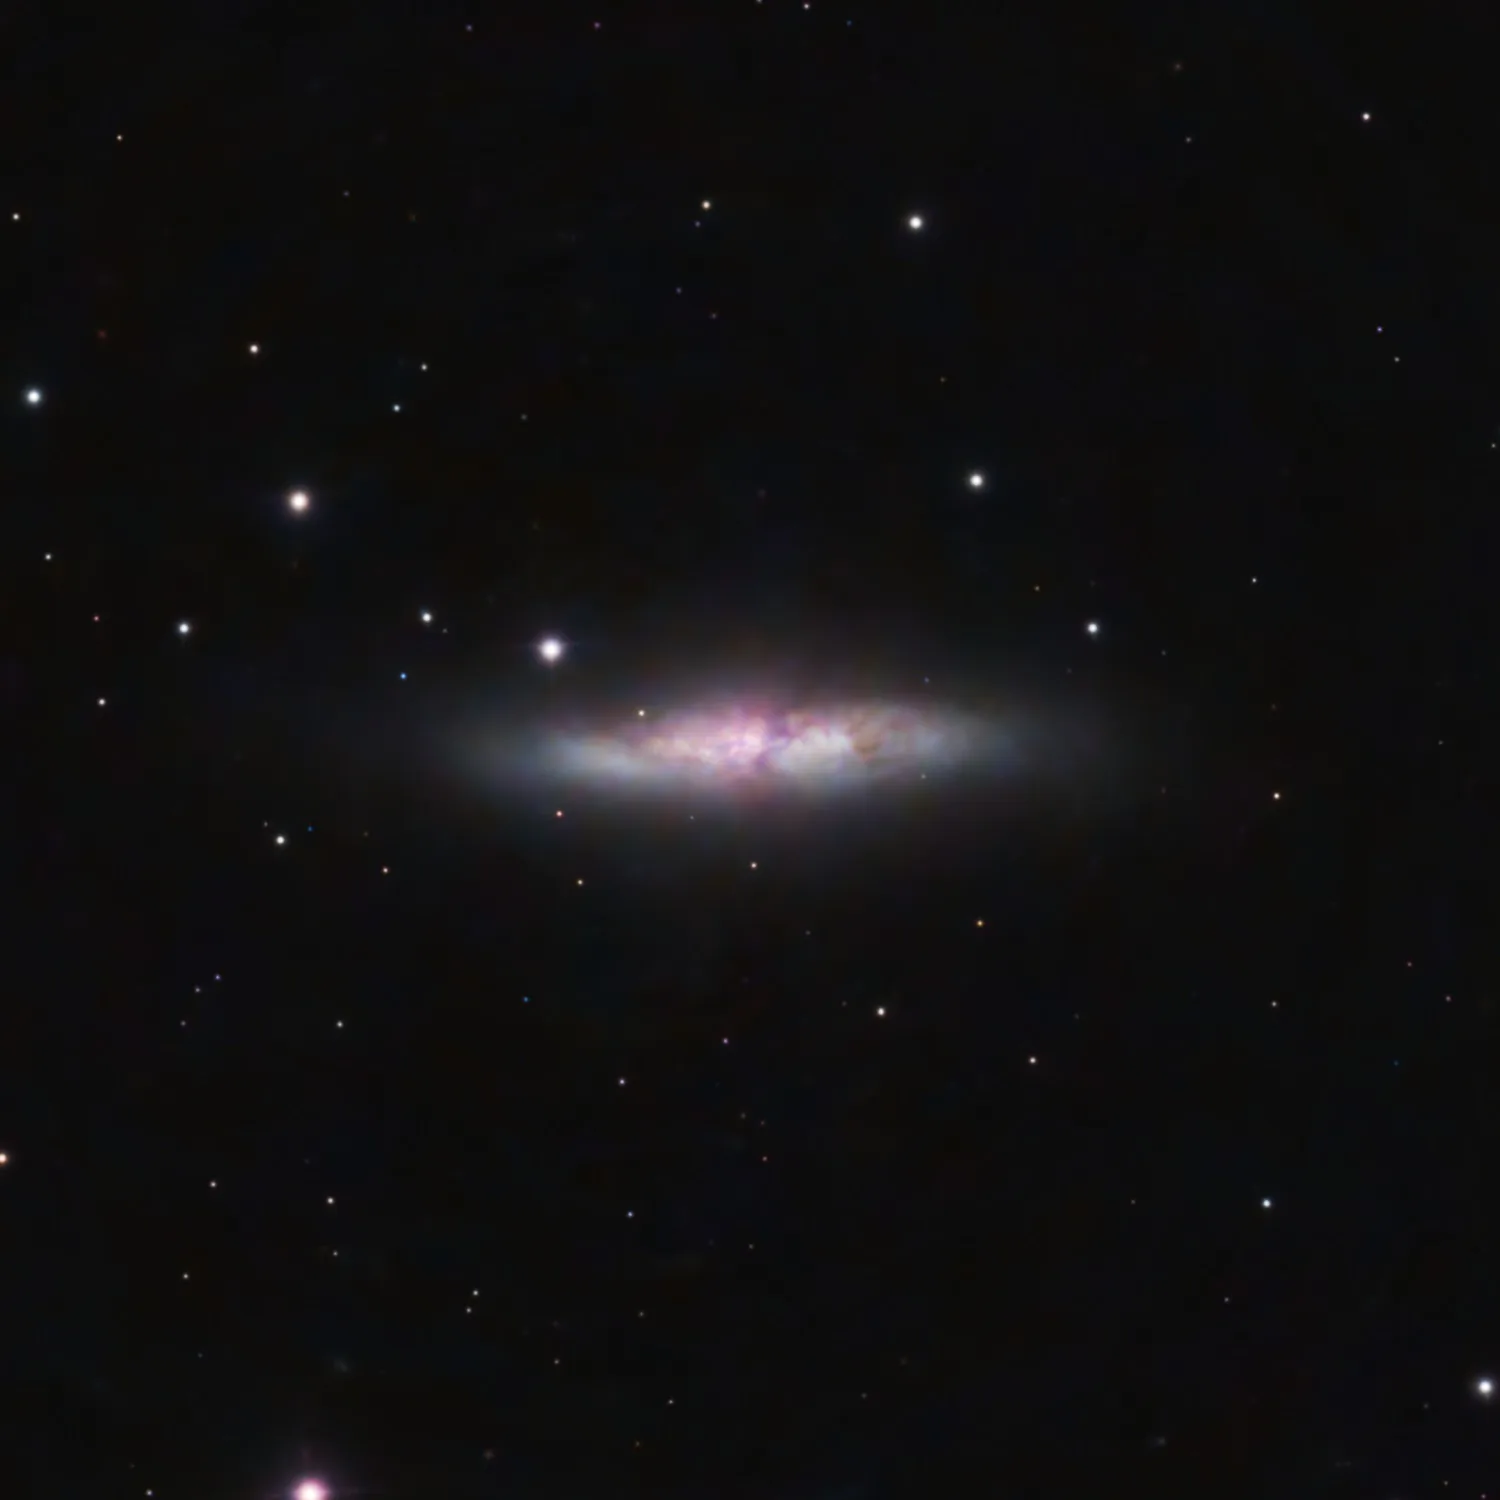
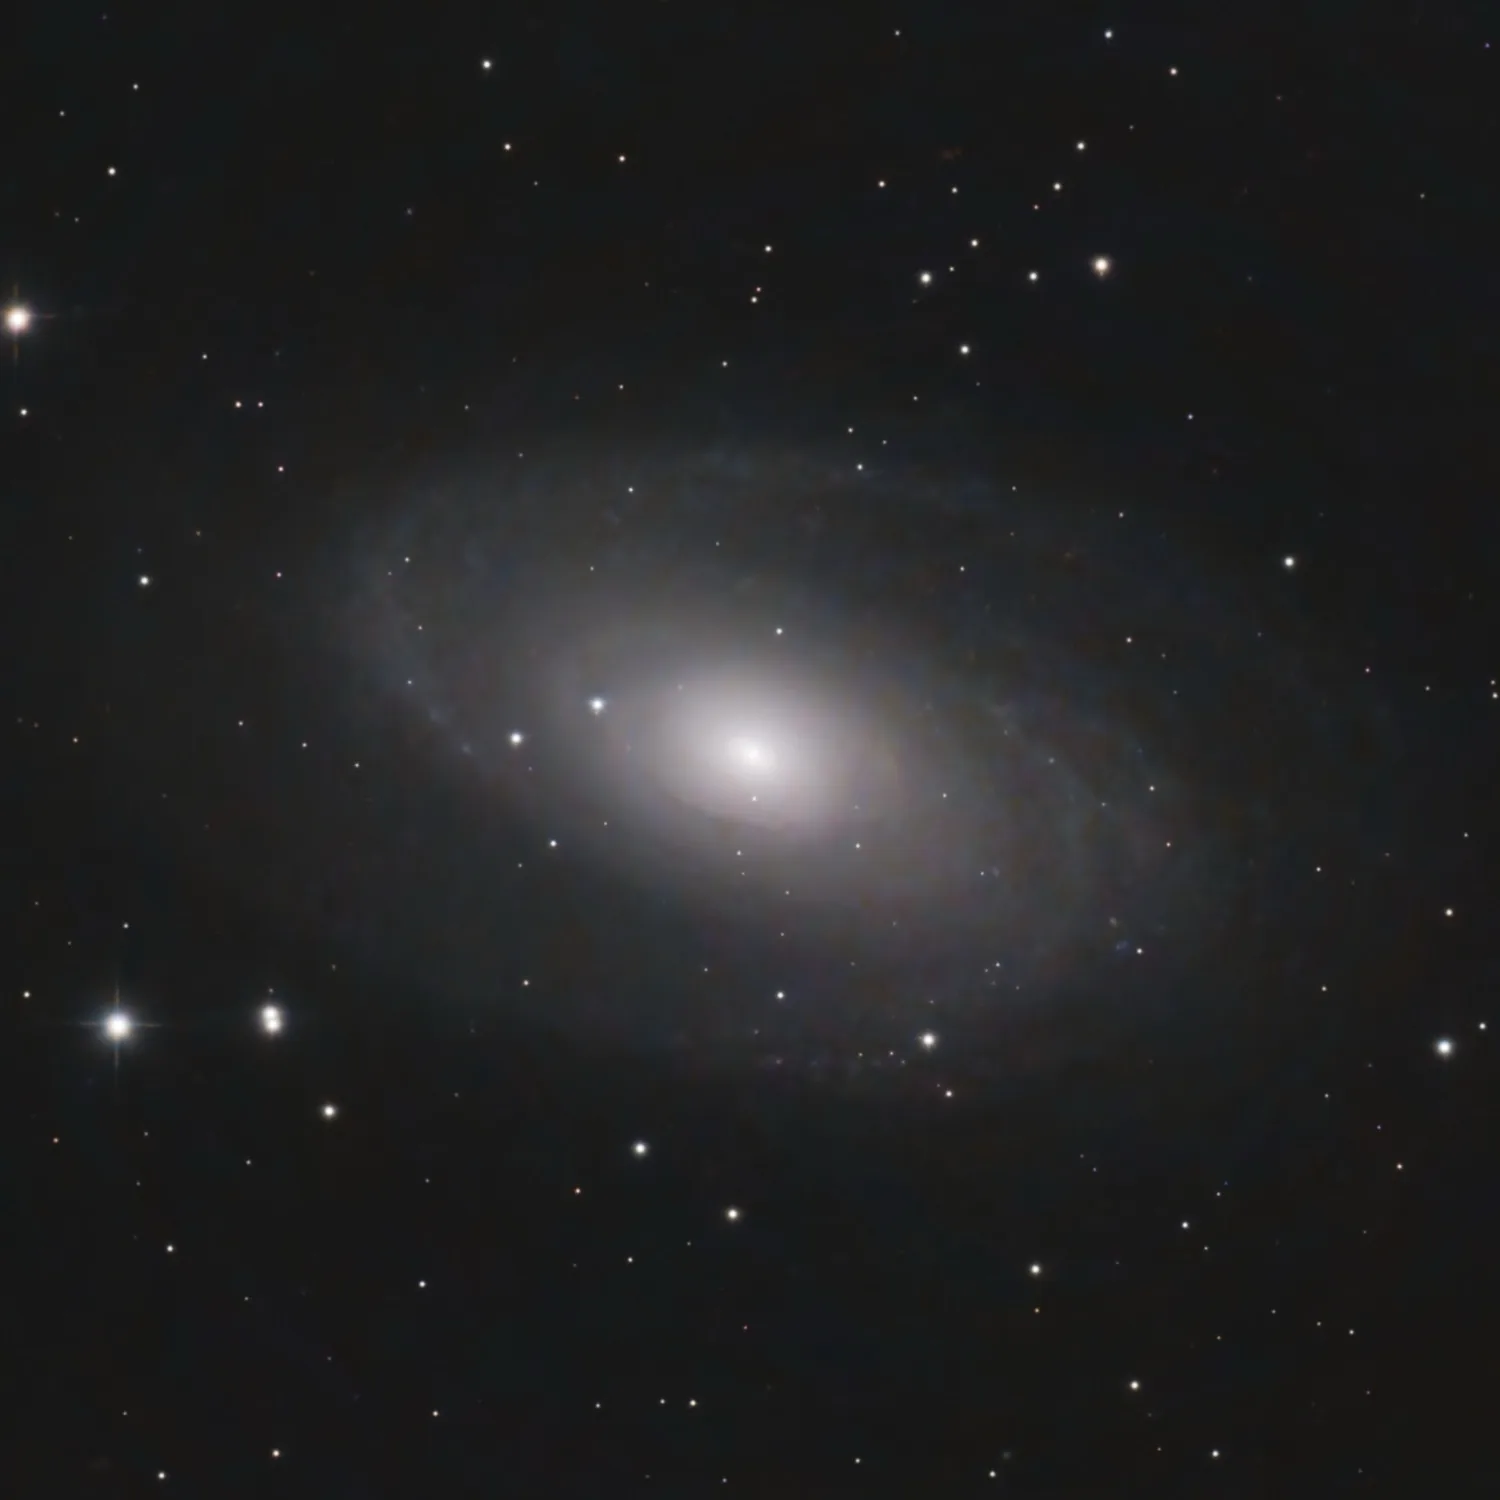
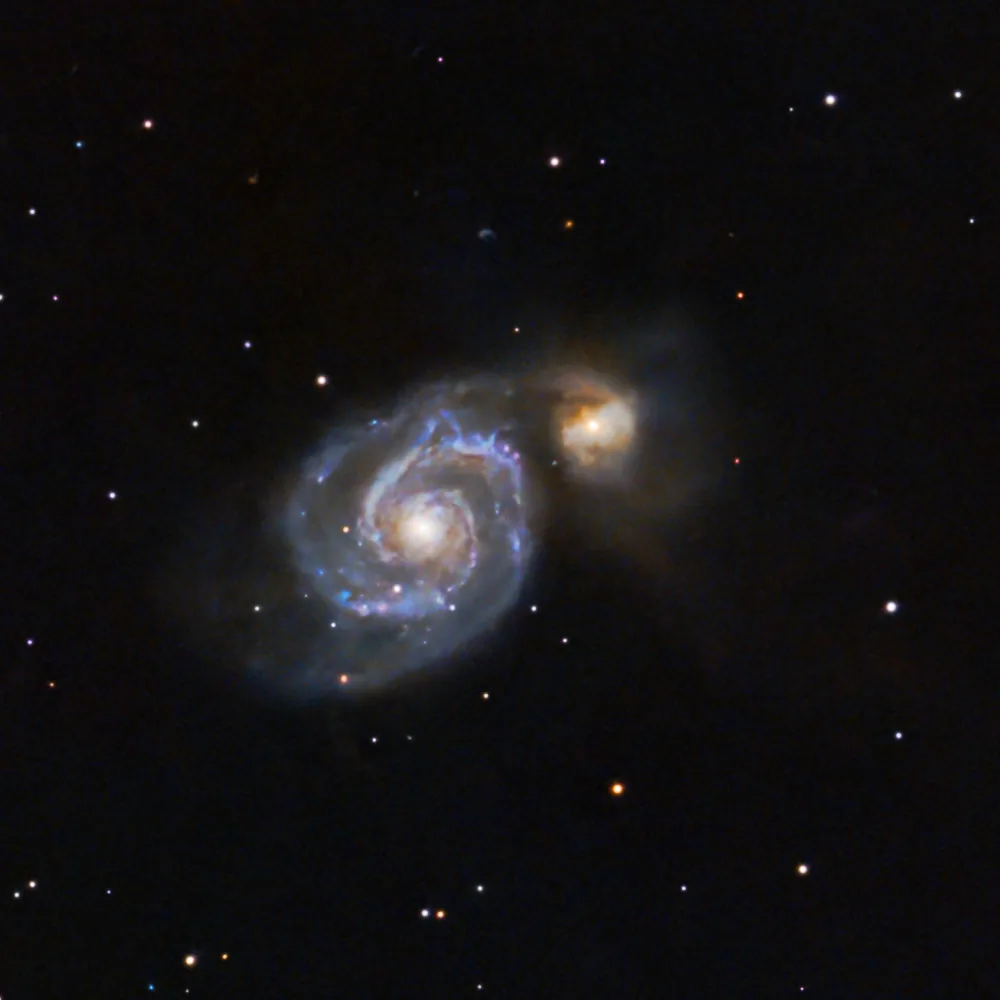
Sample of Low Surface Brightness Galaxies
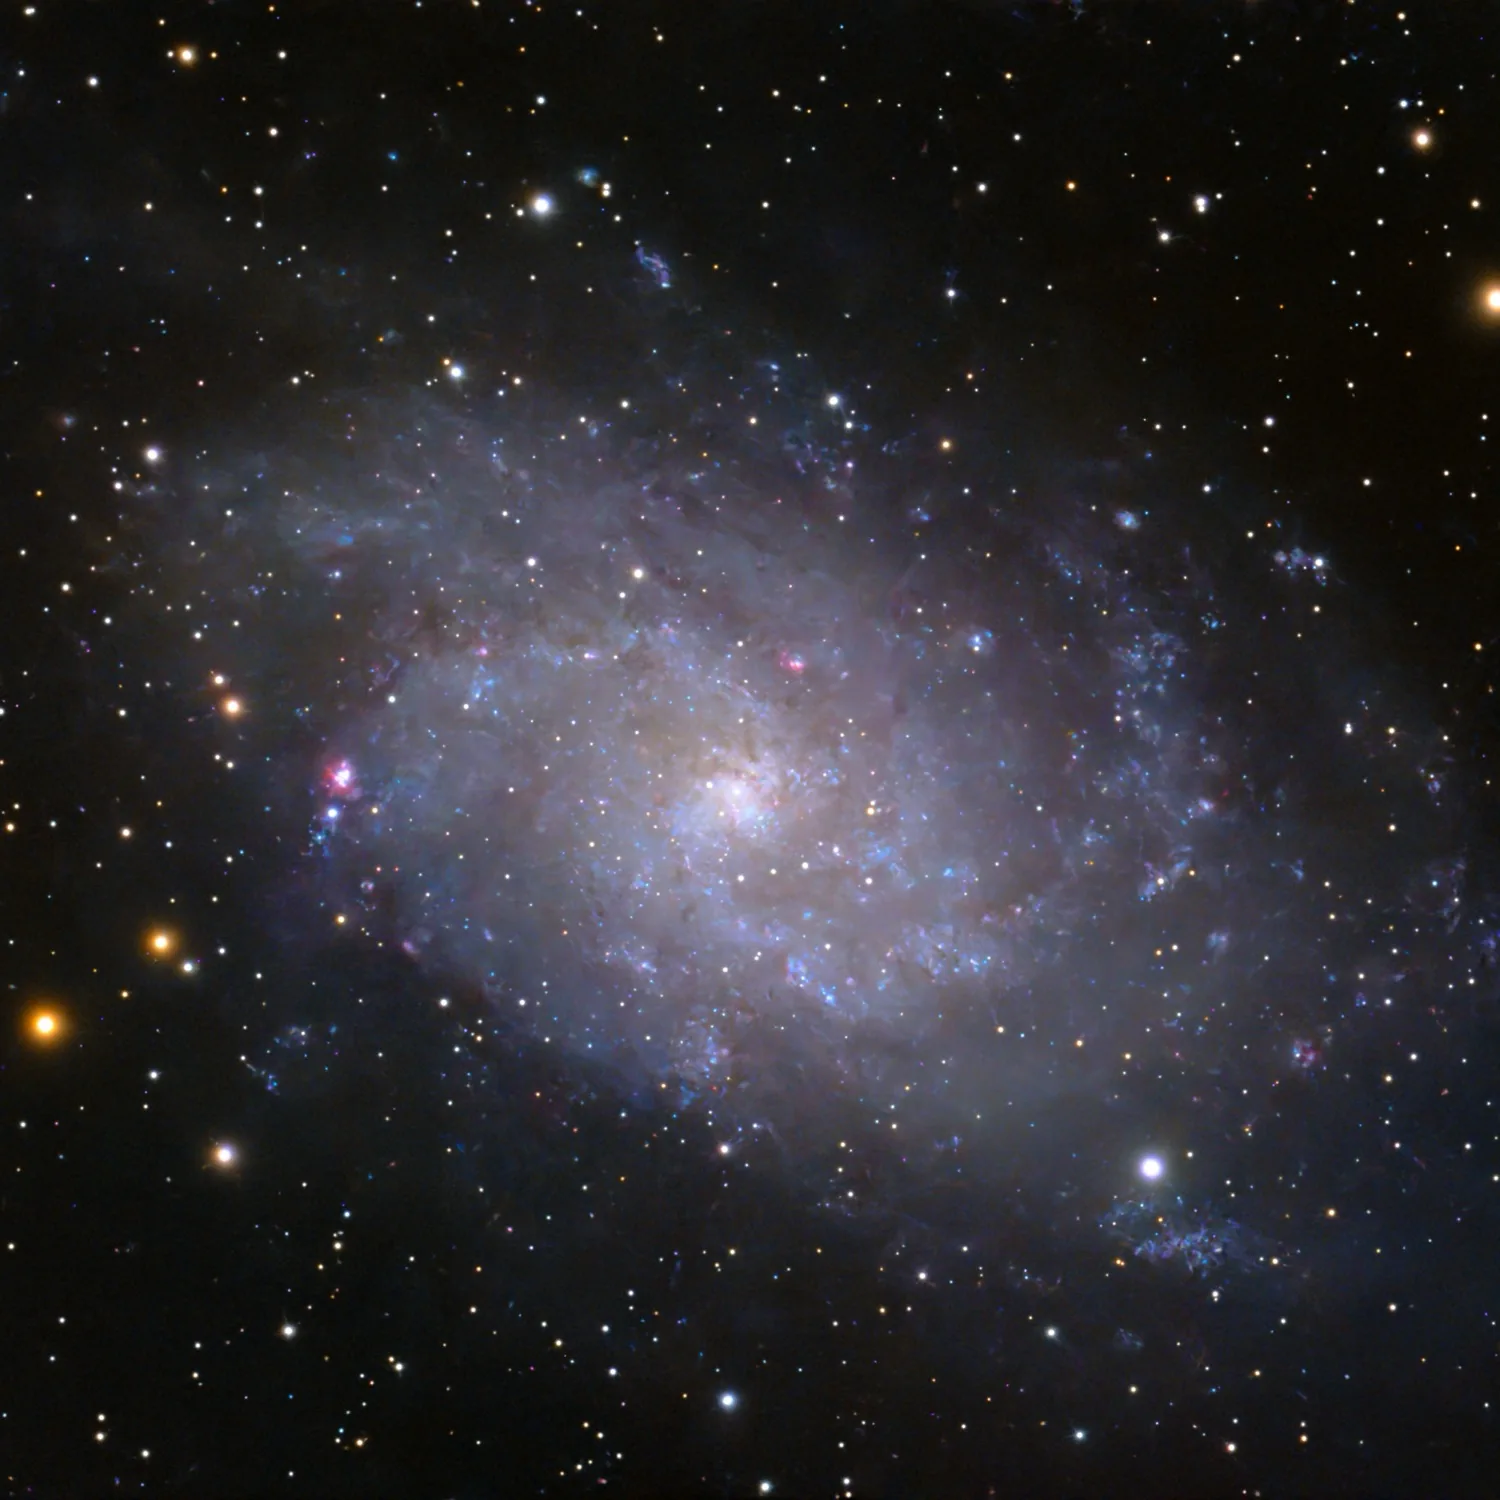
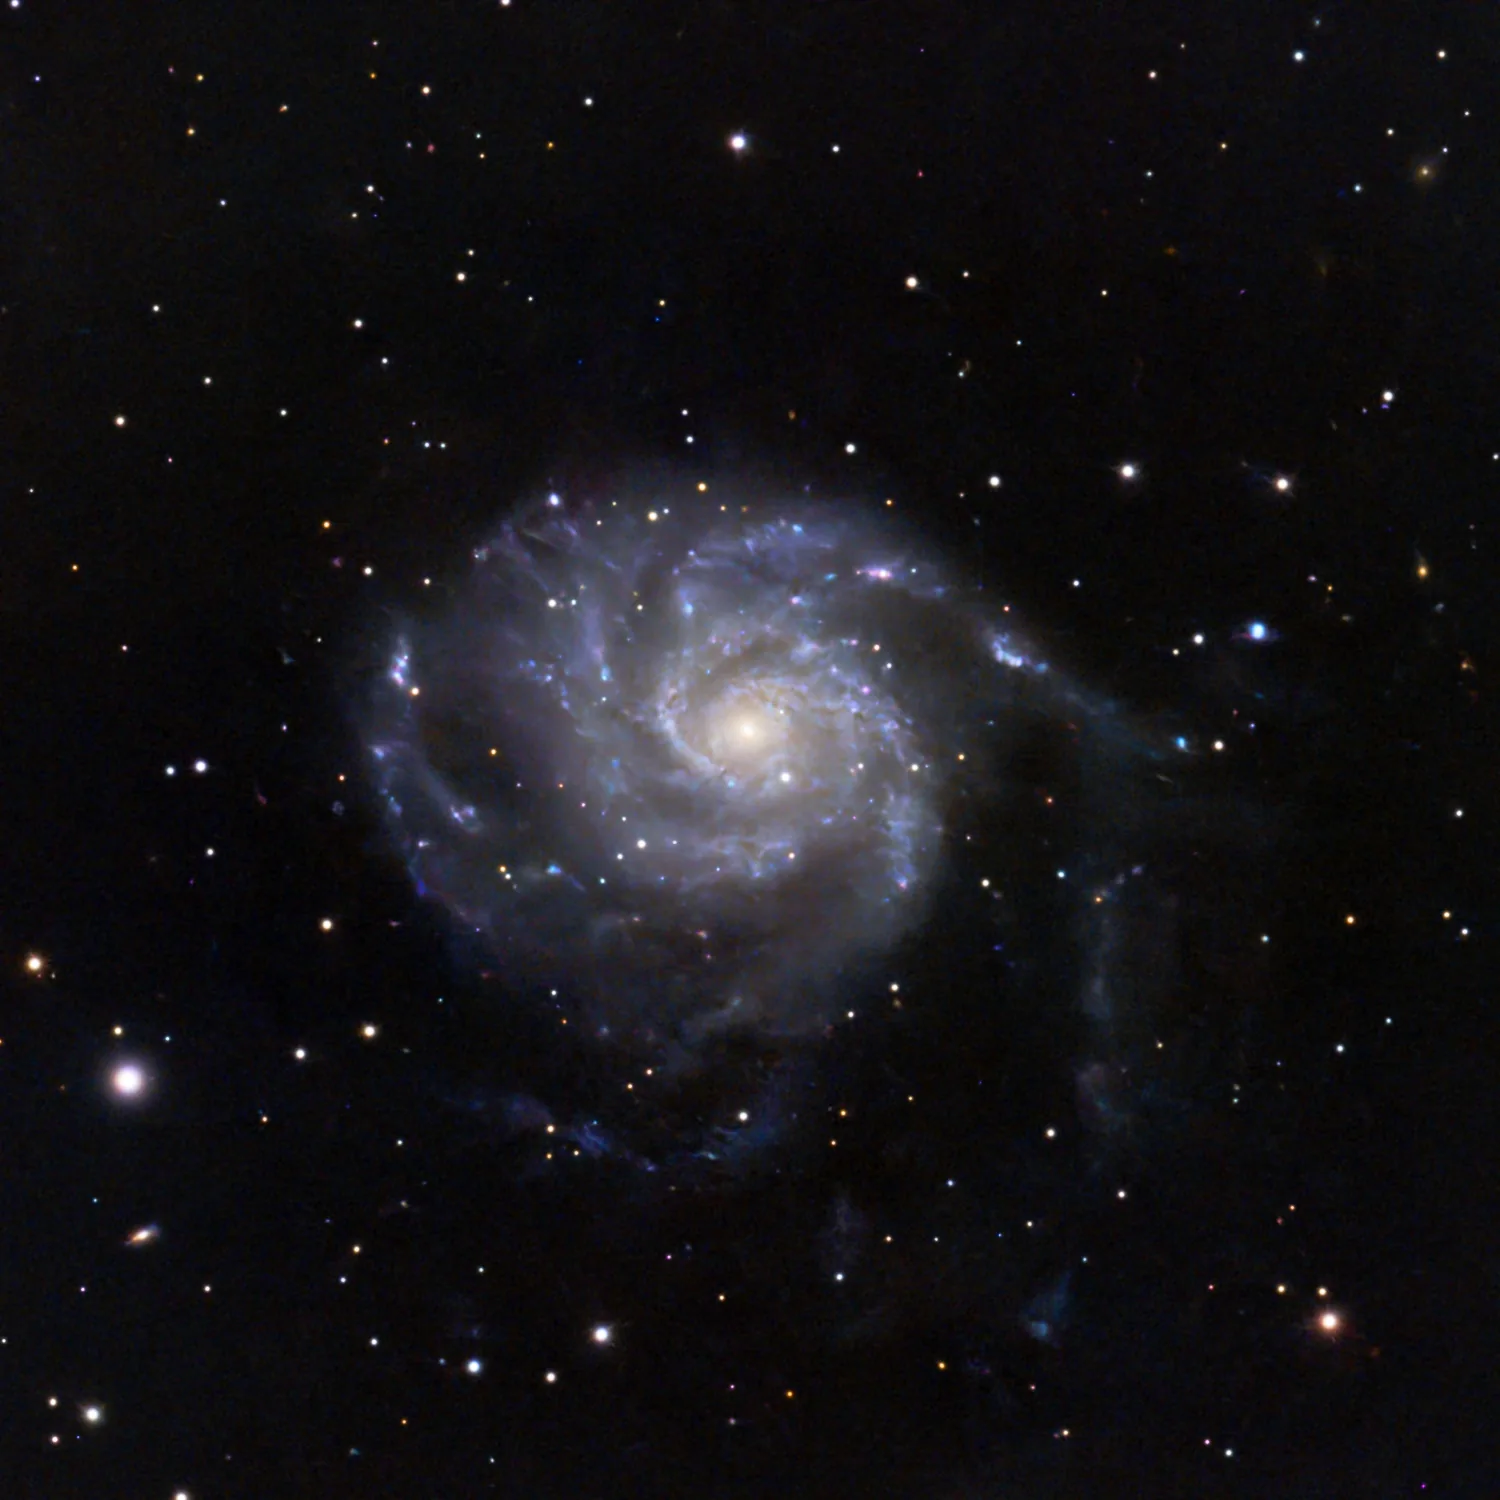
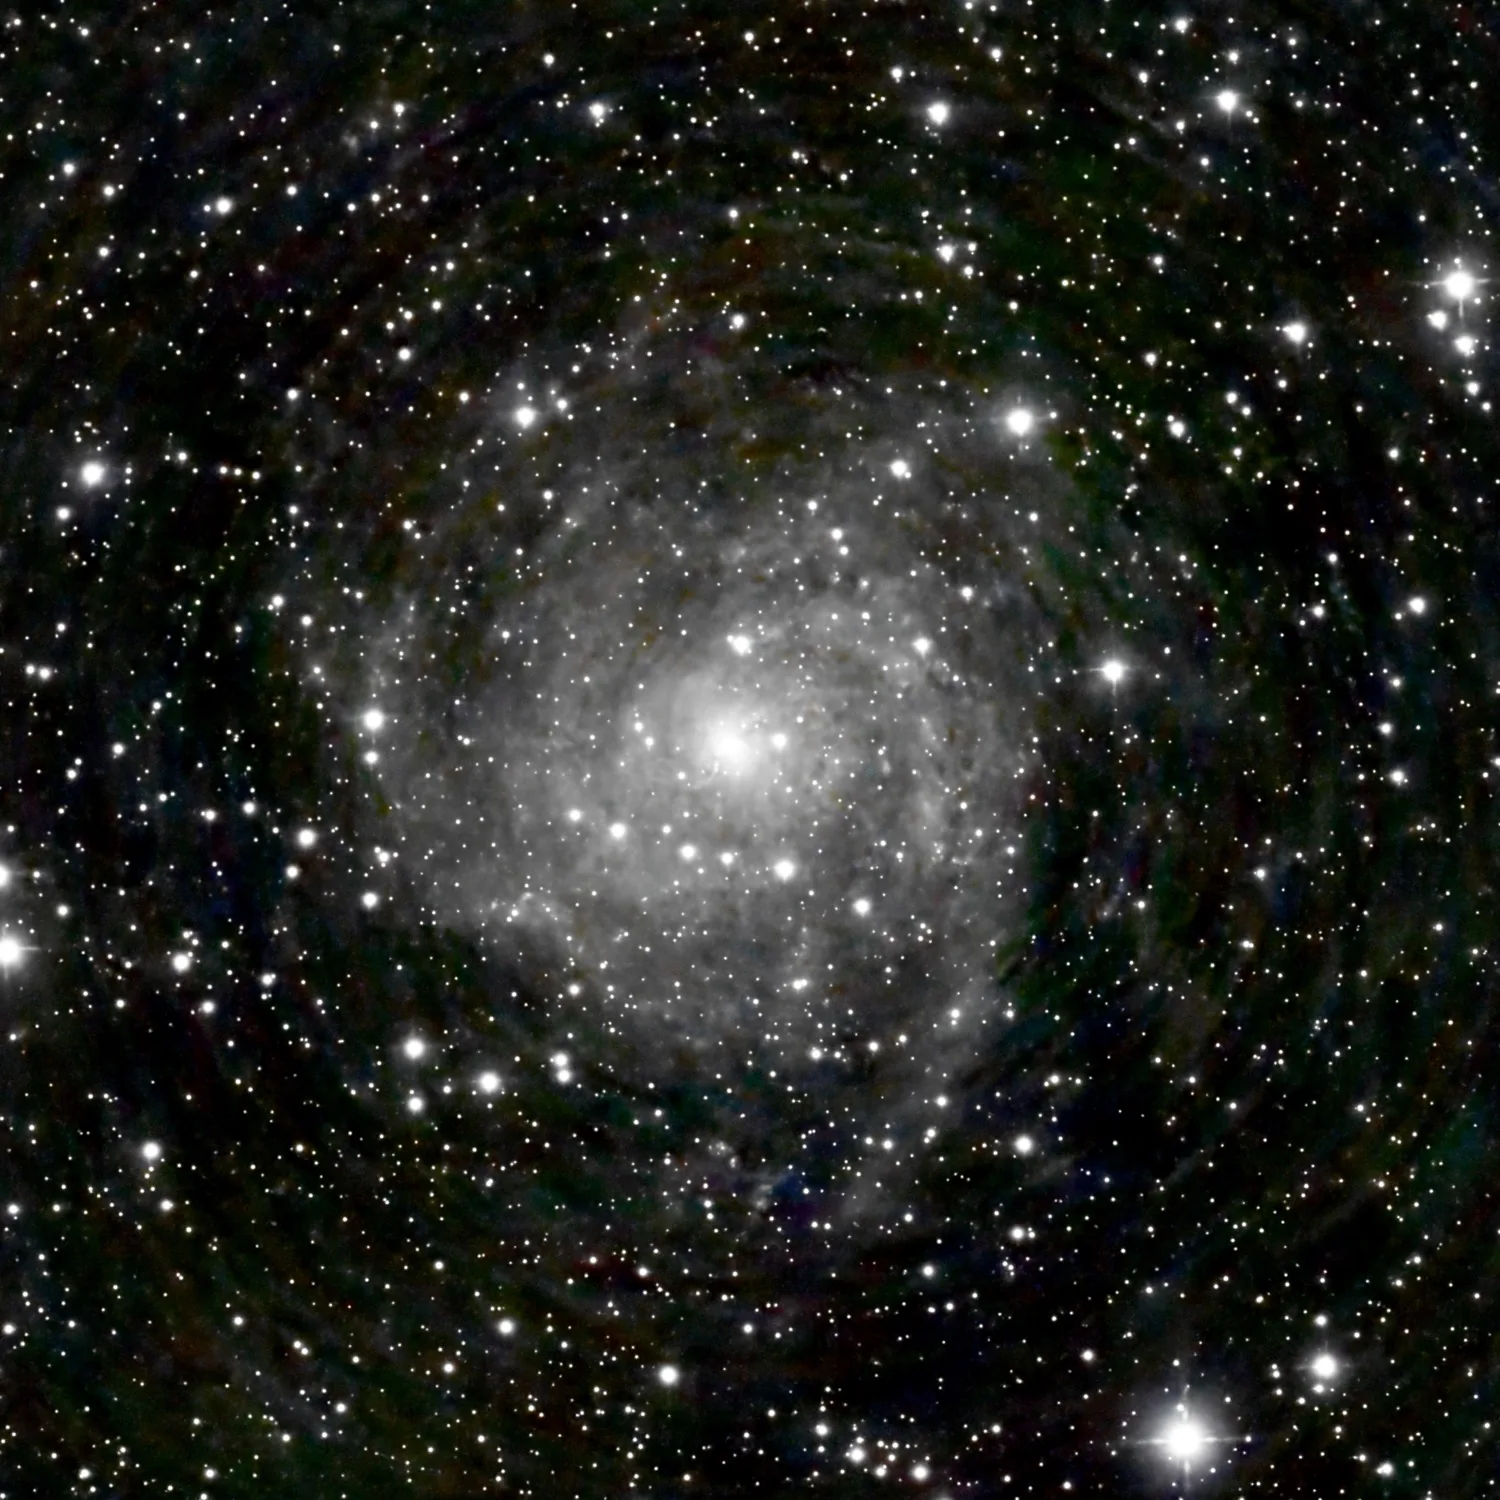
Compare the two galleries and the point makes itself. M33 has the brightest total magnitude of the entire list — 5.7, brighter than every other galaxy here — and yet its surface brightness is worse than M82’s, a galaxy that’s 2.7 magnitudes fainter in total light. M82’s light is concentrated into a small, dense patch of sky; M33’s is spread across an area more than four times the size of the full Moon. Your eye doesn’t see total magnitude. It sees how much light lands in one place, and by that measure M82 wins easily despite “losing” on paper.
IC 342 makes the same point from the other direction. At magnitude 9.1 it’s the faintest galaxy on this list by total light — and it earns a nickname, “the Hidden Galaxy,” specifically because its low surface brightness (compounded by sitting behind dust near the Milky Way’s disk) makes it a genuine challenge object despite being physically large and intrinsically not that dim. Total magnitude alone would never predict that reputation; surface brightness explains it immediately.
Common misconceptions (closer)
A few beliefs about magnitude are common enough, and stubborn enough, that they’re worth naming directly before closing out.
“One magnitude fainter means half as bright.” This is easily the most persistent one, and it’s wrong by a meaningful margin. A single magnitude step is a factor of about 2.512×, not 2× — a number that shows up throughout this article precisely because Pogson built the entire scale around it. Two magnitudes isn’t twice that gap either; the factors multiply, not add. Two magnitudes is about 6.3× fainter, three is about 15.8×, and by five magnitudes you’re at exactly 100× — the number the whole system was calibrated against in the first place.
“A negative magnitude is worse than a positive one.” Backwards, and understandably so — almost every other numeric scale in daily life runs the intuitive direction, where bigger numbers mean more of something. Magnitude runs the other way. Smaller numbers mean brighter; negative numbers mean brighter still. The full Moon at magnitude −12.7 is vastly more brilliant than any star in the sky, all of which sit at positive numbers.
“Going from magnitude 1 to magnitude 6 is a small step, since it’s only five numbers.” The numbers are small; the actual gap is enormous. Five magnitudes is, again, a factor of 100 — the same relationship whether you’re comparing two faint stars near the edge of naked-eye visibility or the Sun to something a hundred times dimmer. The scale compresses huge physical differences into small, easy-to-write numbers, which is exactly what makes it useful and exactly what makes it easy to misread.
| Myth | Fact |
|---|---|
| 1 magnitude fainter = half as bright | 1 magnitude fainter ≈ 2.512× fainter |
| 2 magnitudes fainter = twice as faint as 1 magnitude | 2 magnitudes fainter ≈ 6.3× fainter — the factors multiply |
| A more negative number is a smaller, weaker value | A more negative number means brighter — the scale runs in reverse of most intuition |
Closing
Start to finish, this is a system built in layers: a rough six-tier guess from over two thousand years ago, a precise logarithmic fix from 1856 that never threw the old guess away, and a modern scale so flexible it comfortably describes the Sun, a supernova a billion light-years away, and the faintest smudge JWST can find, all on the same number line. None of it replaces what your own eyes do outside on a clear night — it just gives you a way to talk precisely about what you’re seeing, and sometimes a reason to look more carefully at something you’d otherwise walk past.
That’s the real payoff. Next clear night, the Little Dipper test from earlier in this article is still there waiting — a two-minute check of your own sky’s darkness using nothing but your eyes and the star chart already in your head. So is the gap between M82 and M33, if you’ve got a telescope handy: two galaxies, one obviously easier to find than the other, for reasons that have nothing to do with which one sounded brighter on paper. The numbers in this article are a lens, not a substitute — point them back at the sky.